Start · the question
Everybody knows heat is slow. Nobody quotes a number.
"It was hot" is the universal excuse and the universal explanation, and it is almost never accompanied by a figure. How much slower, exactly? Enough to explain a bad day, or just enough to feel like it did?
One race run repeatedly is the cleanest way to ask. Boston runs the same course every April with a broadly similar field, so year-to-year changes in the median finish time are mostly weather and not geography. Fourteen editions gives fourteen points, each one a whole field's worth of runners collapsed into a single robust number.
↓ the relationship
A straight line through fourteen years
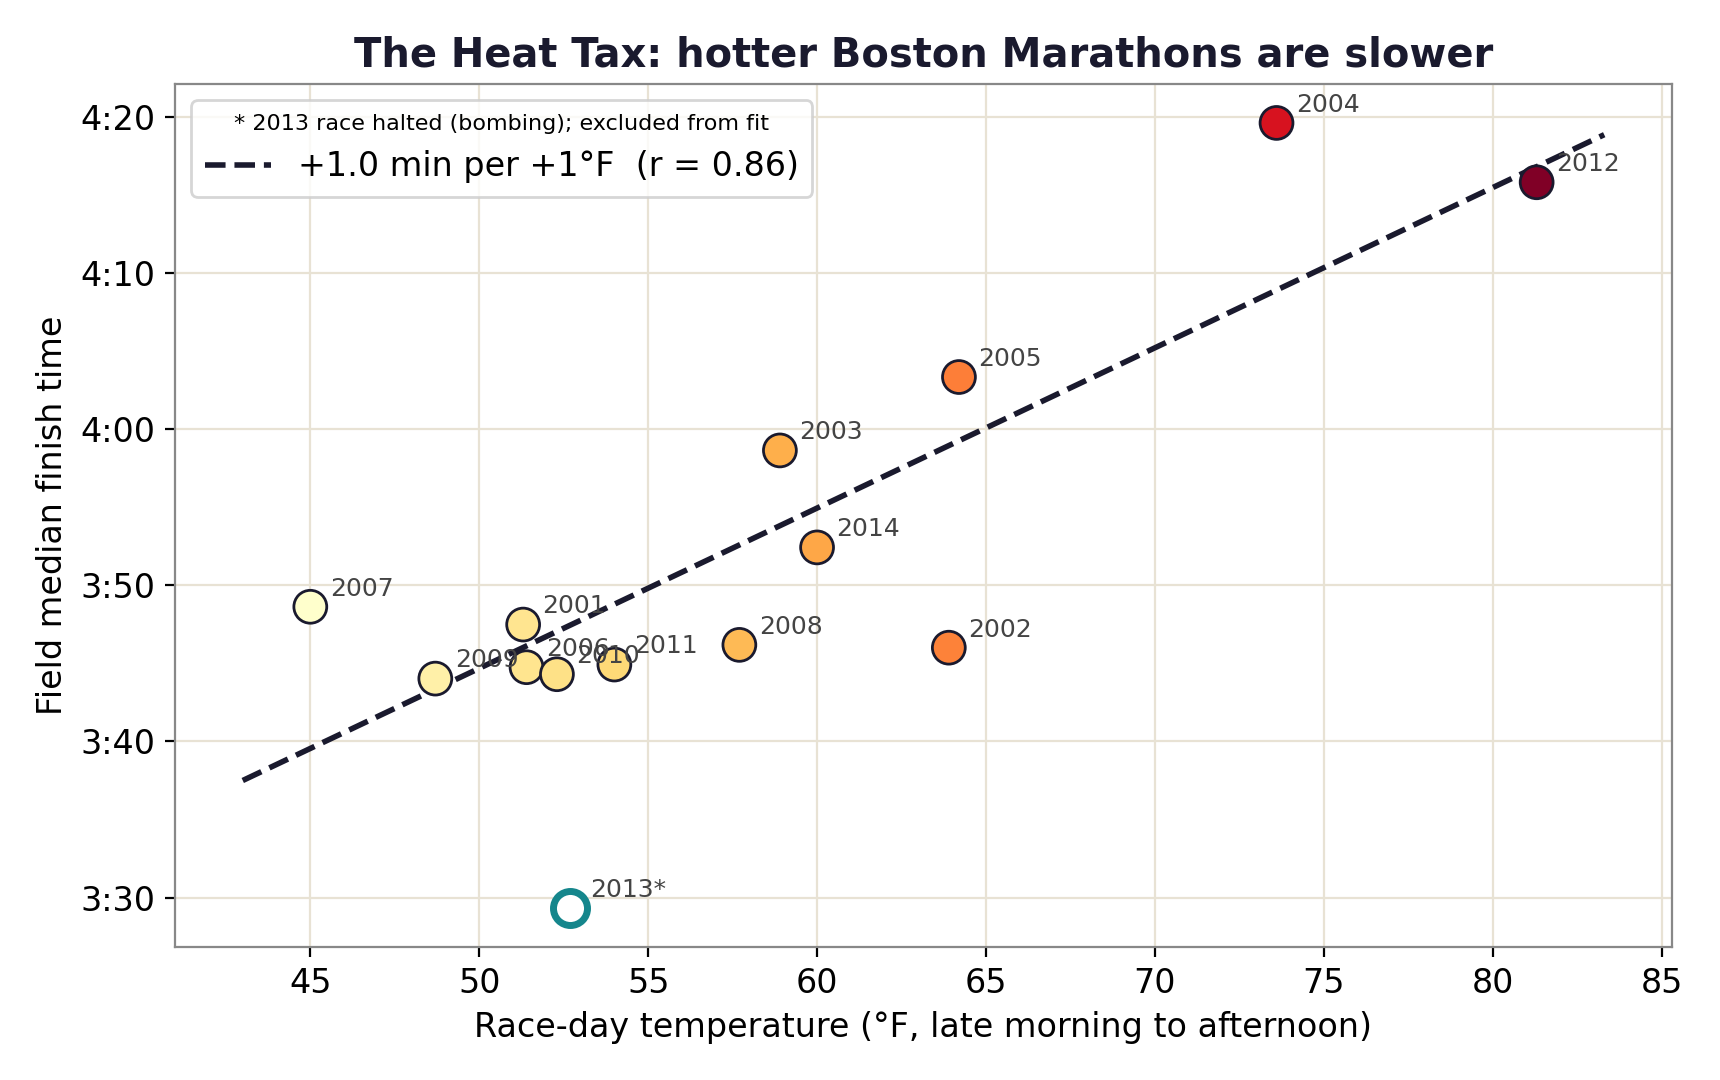
correlation between race-morning temperature and the field's median finish.
Each point is an entire Boston field. The fit slopes upward at close to a minute per degree and the scatter around it is small. For a relationship built from real race days rather than a laboratory, that is a tight result.
The practical translation: 50°F to 80°F is about 31 minutes on the median finish. That is the difference between a good day and a day people talk about for years.
↓ year by year
The hot years are the slow years
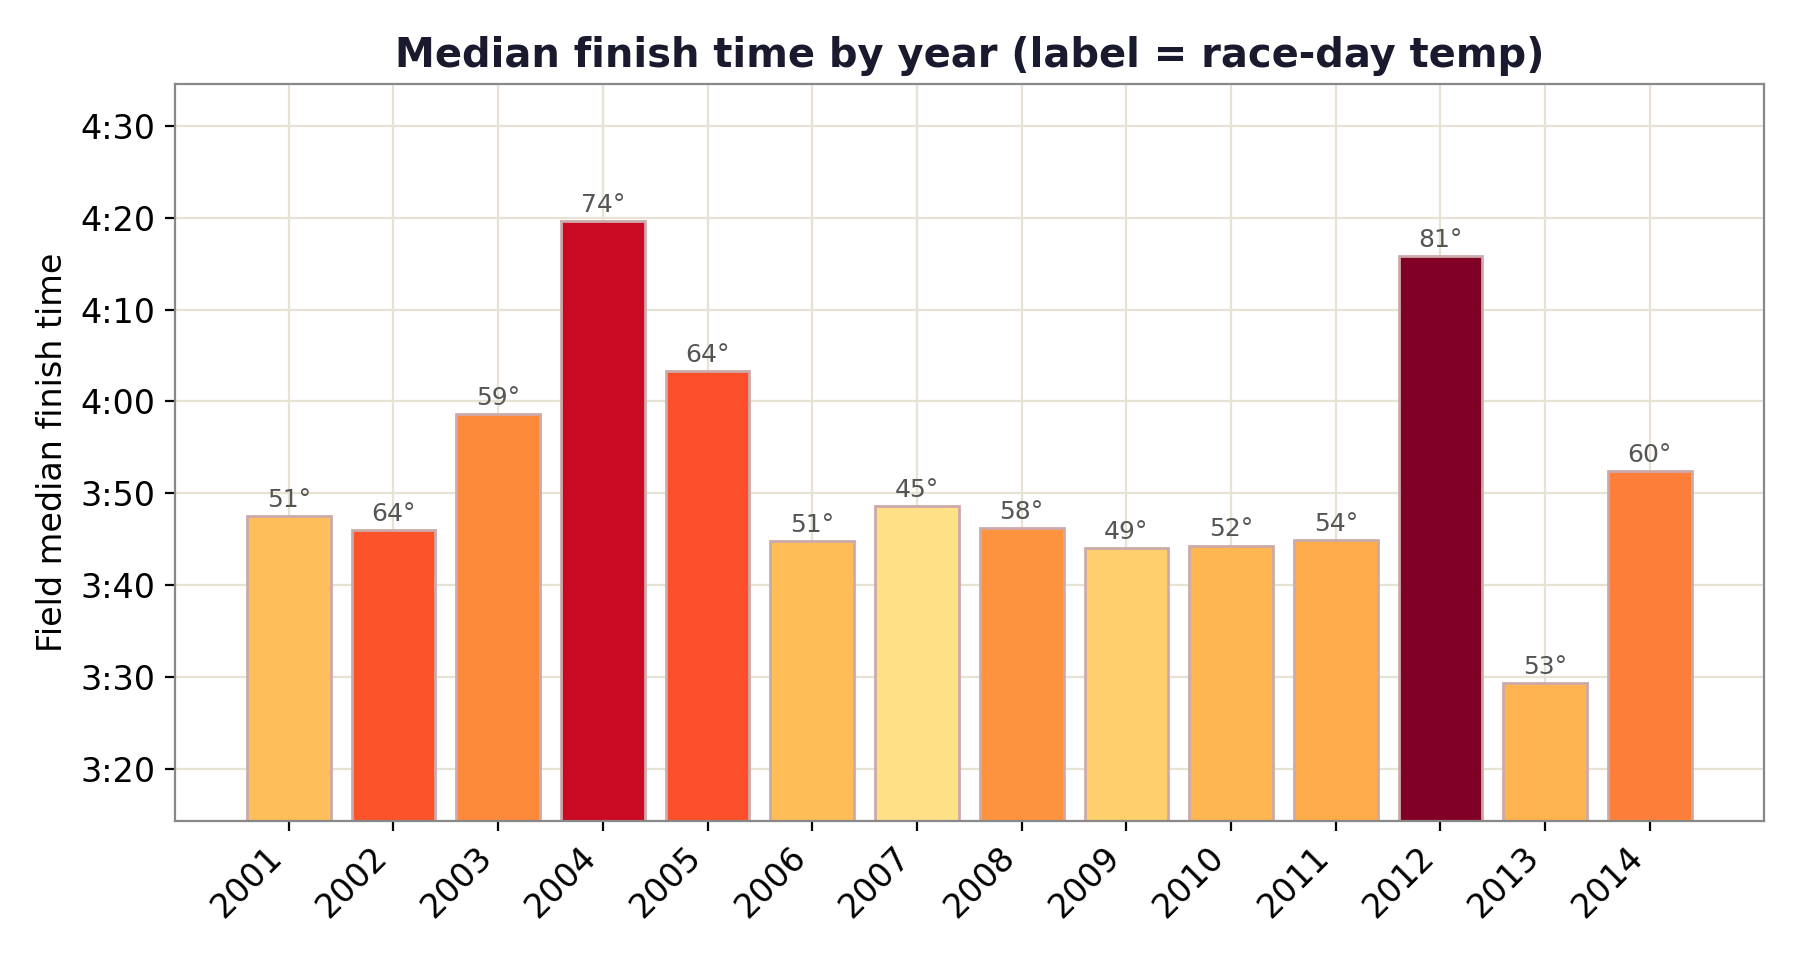
Plotted chronologically the same story shows up as spikes. 2012, at 81°F, and 2004, at 74°F, stand out as both the warmest mornings and among the slowest fields in the set. There is no warming trend hiding in here and no steady drift; the median finish simply tracks whatever the thermometer did that morning.
↓ what this cannot tell you
Fourteen points is fourteen points
This is a descriptive relationship across fourteen observations, not a controlled experiment. Field size, qualifying standards and the make-up of the entry list all shifted over these years, and any of them could push the median around independently of the weather.
2013 is excluded from the fit, and it should be. The race was stopped after the bombing, so its finisher set is truncated in a way that has nothing to do with temperature. Leaving it in would have quietly corrupted the slope. It is dropped explicitly rather than silently.
Temperature is also a stand-in for a bundle of things that travel together: humidity, sun, and radiant heat off the road. The one-minute-per-degree figure should be read as the cost of a warm race morning, not of dry-bulb temperature specifically.
With those stated, the effect is large, it points the way sports-science literature says it should, and it is stable enough that no single year drives it.
↓ so what
Adjust the goal, not the effort
The useful version of this number is a pre-race one. If the forecast is 15 degrees above what you trained in, the honest expectation is a finish time about fifteen minutes softer, and chasing the original number is how the back half of the race falls apart.
The heat does not take the time from you at the finish. It takes it in the last 10 km, from whoever refused to give it up at the start.
Read alongside the pacing-decay studyFinish · how it was built
Where the numbers come from
fetch_data.py pulls both halves — the results and the historical
weather — and analyze.py produces the figures and the summary
table. Both sources are free and public, and the raw downloads are
git-ignored so the repository stays small.
- Results
- Boston Marathon finishers 2001–2014, via the public llimllib/bostonmarathon mirror
- Weather
- Open-Meteo historical archive, mean of the 10:00–16:00 window near the course
- Median over
- Finishers between 2 and 8 hours, which trims timing artefacts without trimming the field
- Excluded
- 2013, whose field was truncated when the race was halted
- Built with
- Python, pandas, matplotlib
- Related
- The same figure powers a knowledge card in Marathon Strategy RAG and the heat rule inside Race Day Copilot