Data story · 31,655 marathon finishers
Hitting the Wall
Marathoners talk about "the wall" near 20 miles. Using every runner's 5-kilometre splits, I traced exactly where the field slows, and how hard.
What "the wall" actually looks like
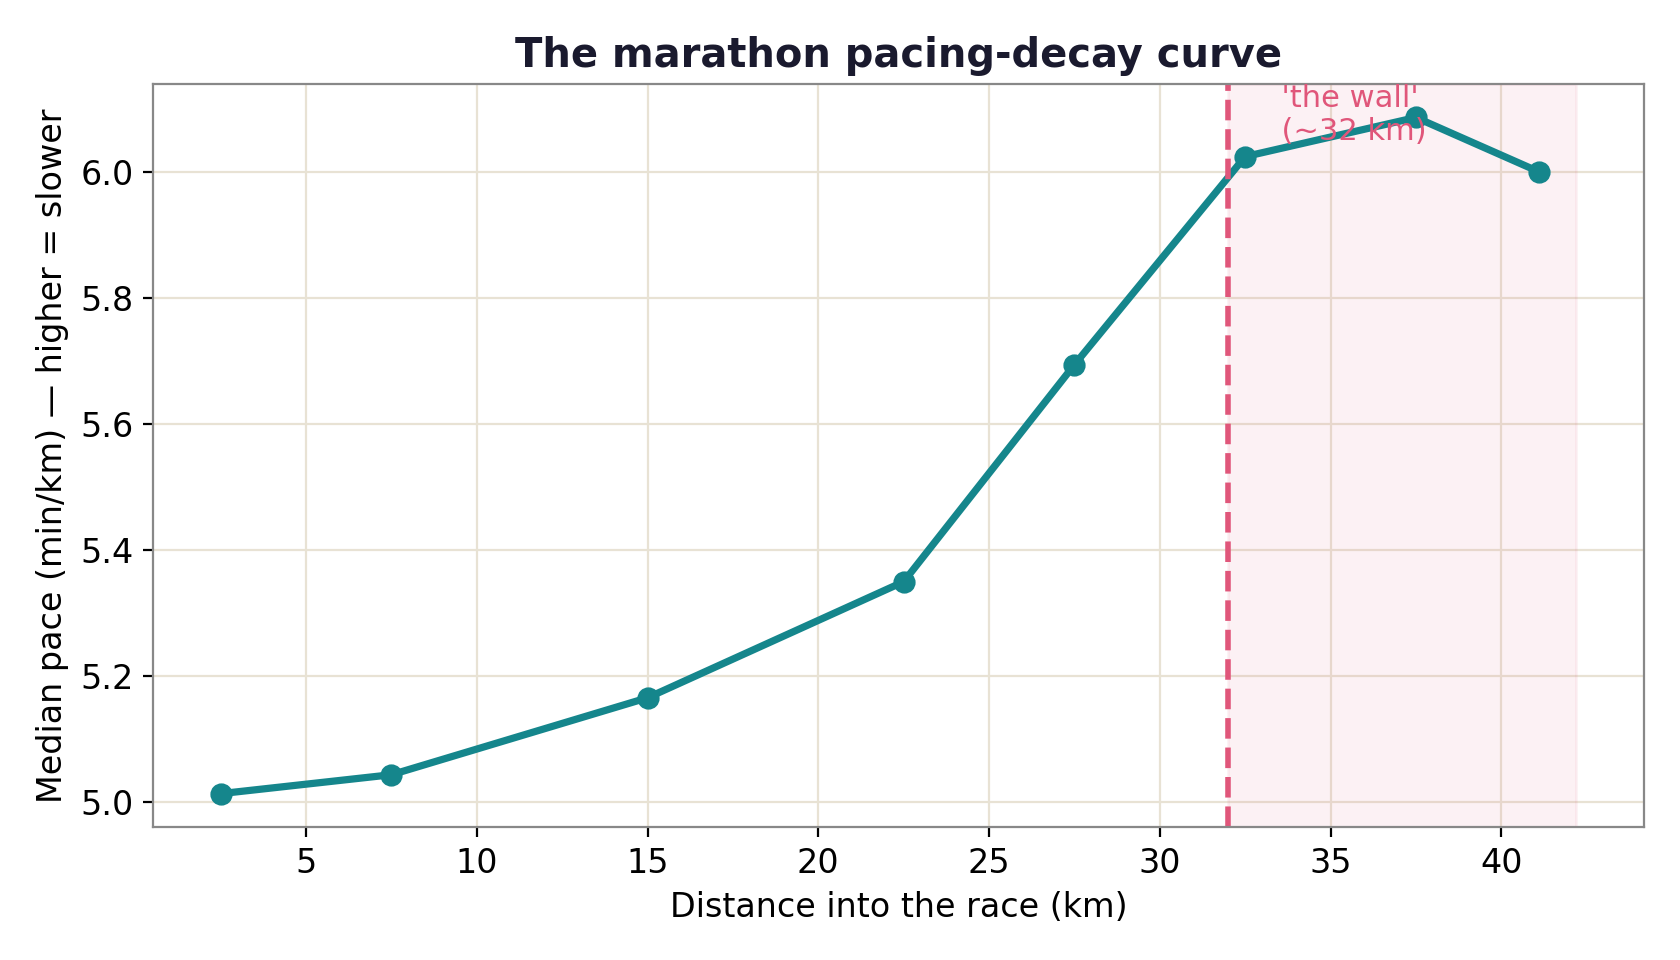
Every finisher of the 2014 Boston Marathon crossed timing mats every 5 km. Converting those to a running pace and averaging across the field, a very clear shape appears: pace holds nearly flat for the first 20 km, drifts up gently to 25 km, and then climbs steeply from about 30 km onward. The textbook "wall." By 35–40 km the median runner is moving roughly a minute per kilometre slower than they were at the start.
It hits slower runners far harder
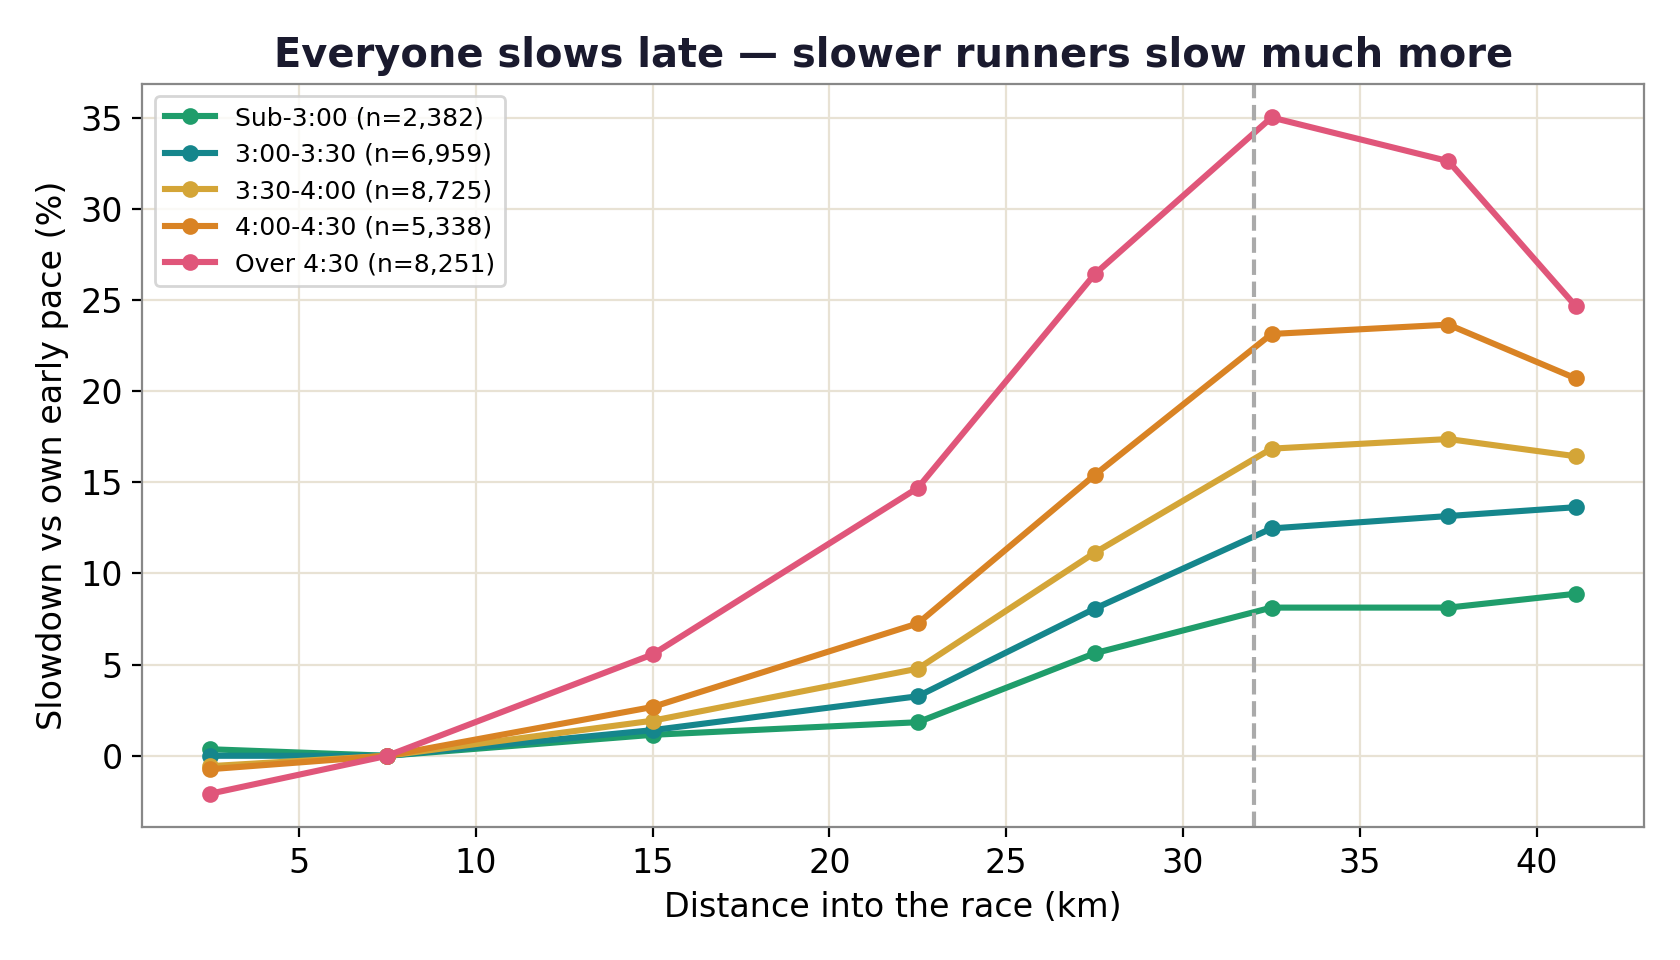
The wall isn't democratic. Measured against each group's own early pace, sub-3-hour runners barely slow at all, while runners finishing over 4:30 balloon by 30% or more in the closing kilometres. Fitness mostly shows up as the flatness of this curve.
How bad is it, runner by runner?
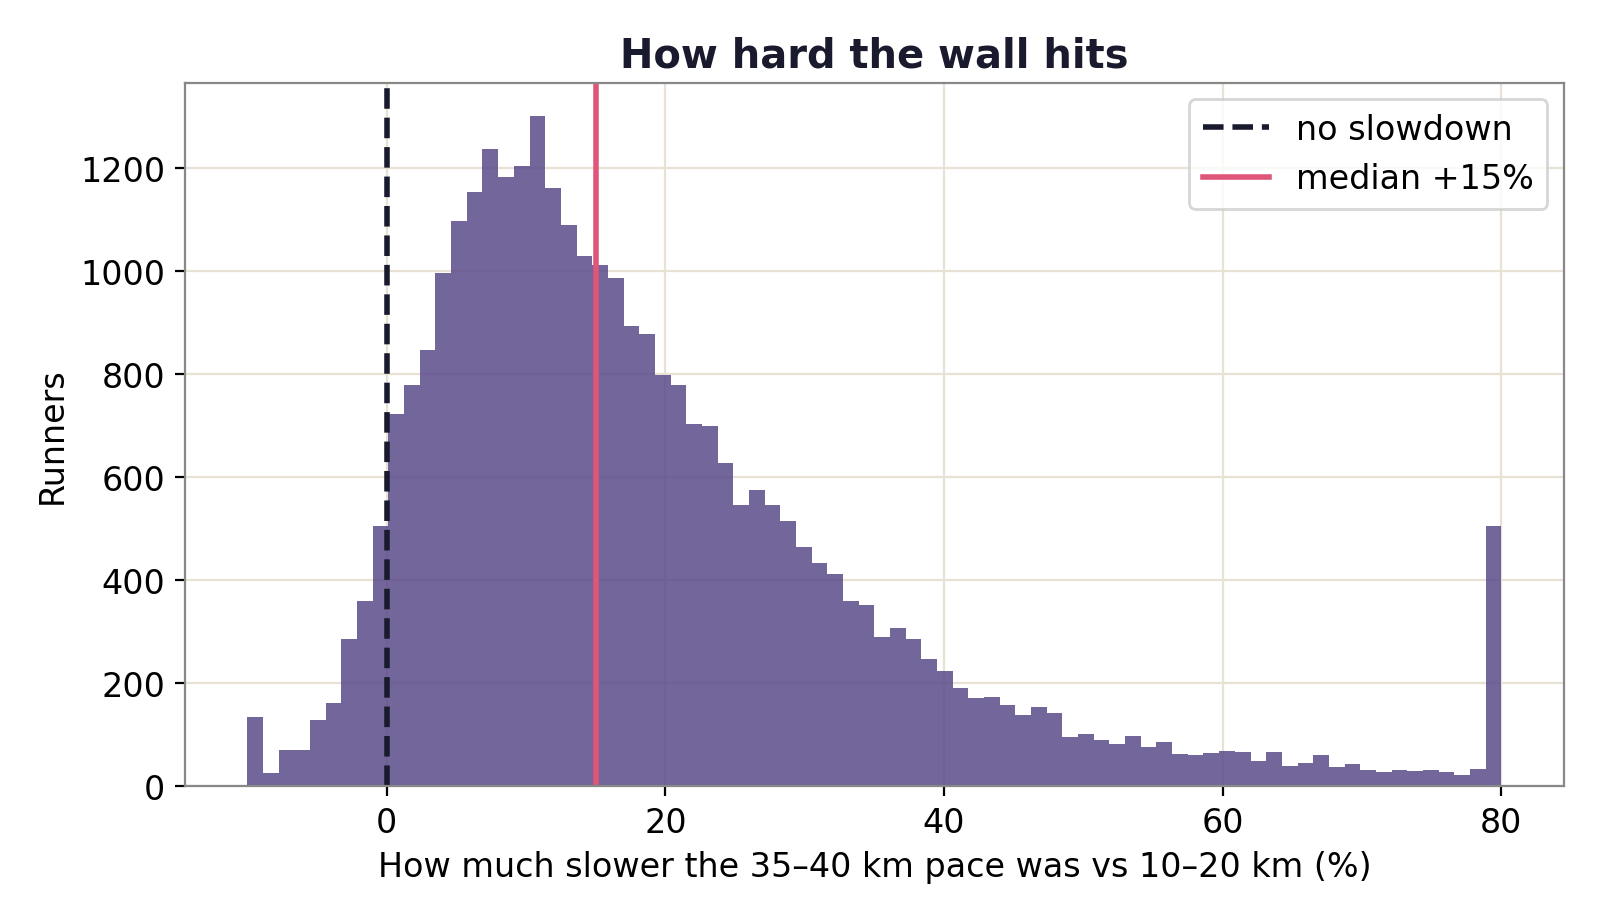
Comparing each runner's 35–40 km pace to their steady 10–20 km pace, the median late slowdown is 15%, but the tail is long: more than a quarter of the field slowed by over 25% in the final stretch.
The findings
- Pace stays flat to ~20 km, then climbs steeply from ~30 km. The wall is real and shows up in the average.
- The median runner's late pace was 15% slower than their mid-race pace; 27% slowed by more than 25%.
- Slowdown scales with finish time: elites stay nearly flat, while 4:30+ runners slow 30%+ late on.
- The field's median pace drifts from ~5.0 to ~6.1 min/km between the early kilometres and 35–40 km.
The takeaway
"The wall" isn't a metaphor. It's a measurable bend in the pace curve that arrives, on average, right around 30 km. And because the bend is so much gentler for fitter, more even-paced runners, the practical lesson lines up with every coach's advice: train your endurance, and start conservatively, because the last 12 km is where marathons are won and lost. (See also my companion study, The Negative-Split Myth.)
fetch_data.py + analyze.py in the repo. Boston's net-downhill start flatters early pace, so the real-world slowdown is, if anything, understated here.