55,597 wine reviews against thirty years of growing-season weather
An extra degree of summer is worth a fraction of a point
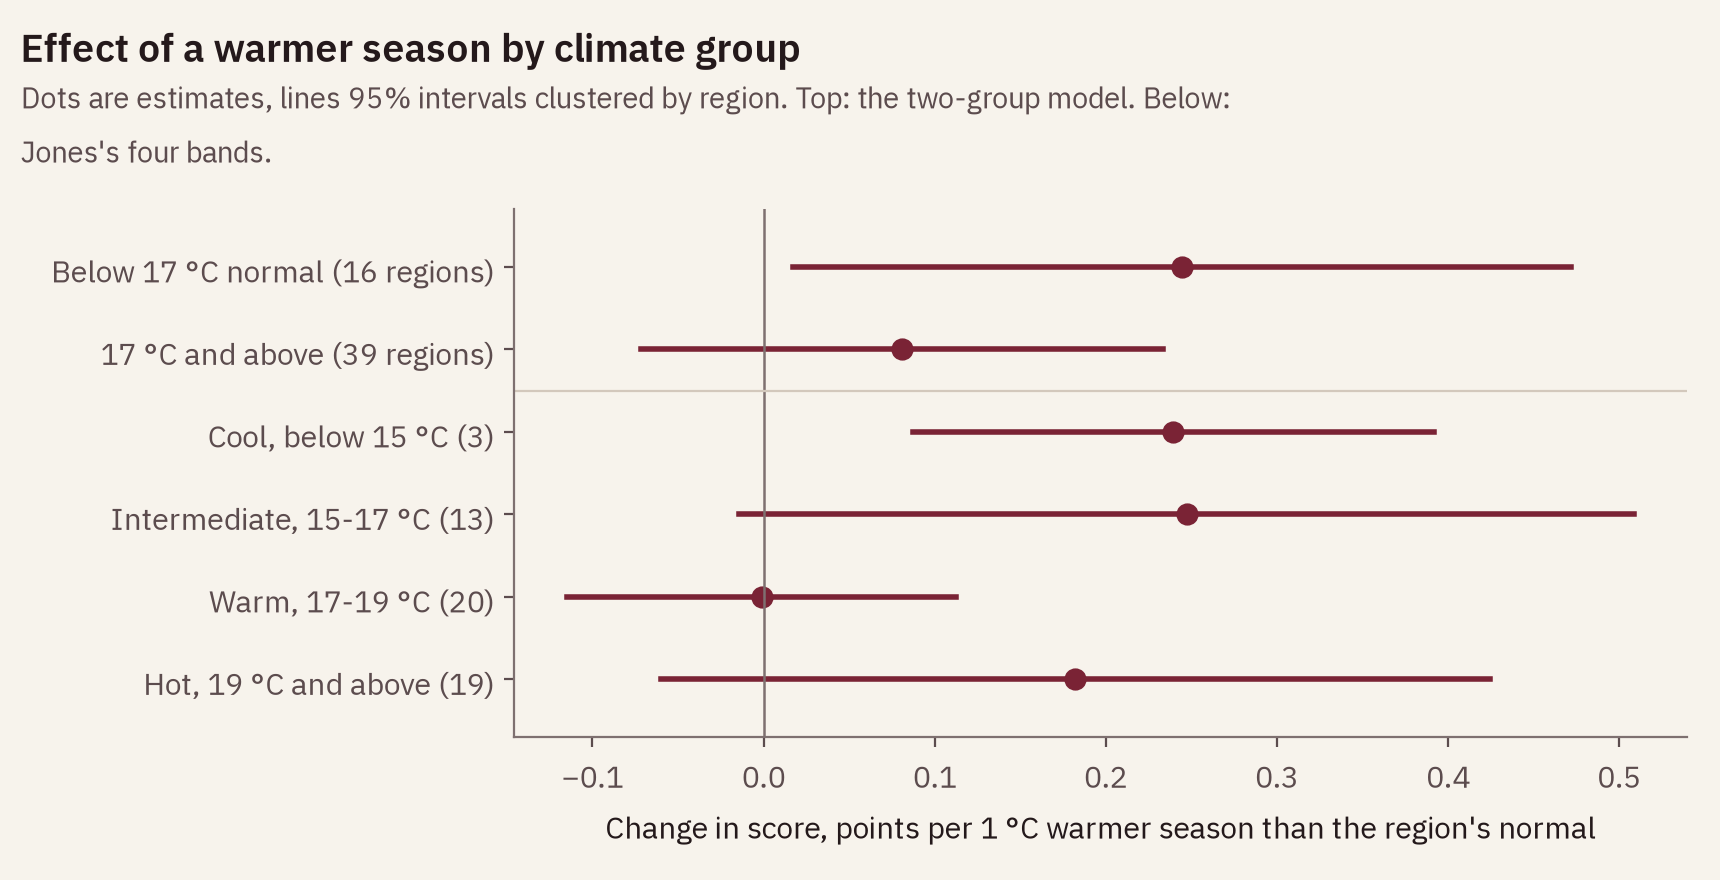
A growing season 1 °C warmer than a region's normal moved Wine Enthusiast scores by +0.24 points in cool regions and +0.08 points in warm ones. The gap between the two is not statistically clear, and no climate group shows a significant negative effect.
Each vintage against its season
pick a region
The numbers for this region
| Vintage | Season vs normal, °C | Score vs expected | Mean score | Reviews |
|---|
- +0.24
points per 1 °C of extra season warmth in the 16 regions whose normal season is below 17 °C (95% interval 0.02 to 0.47, p = 0.035).
- +0.08
points per 1 °C in the 39 regions at 17 °C and above (−0.07 to 0.23, p = 0.29). No significant negative effect, though 29 of the 55 regions taken one at a time slope downward.
- +0.13
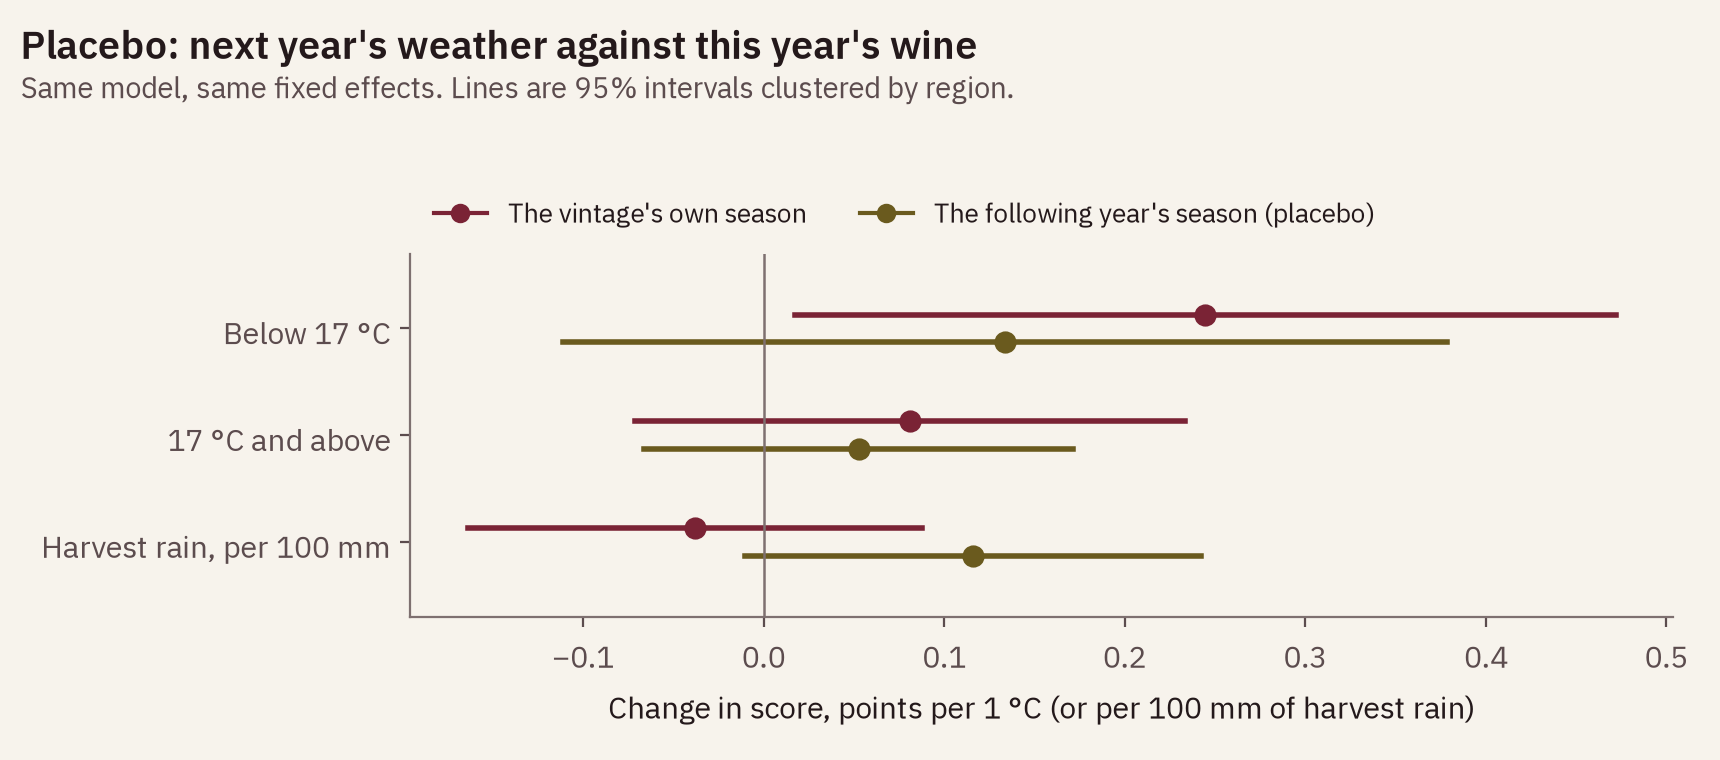
points for the placebo: the following year's season, which cannot touch the wine, in the cool group (p = 0.28). It is about half the real estimate, so the real one is not clean.
- 1.5%
smaller prediction error when the weather is added to region-variety averages and one vintage is held out at a time (1.313 to 1.293 points).
First
Each region against its own normal
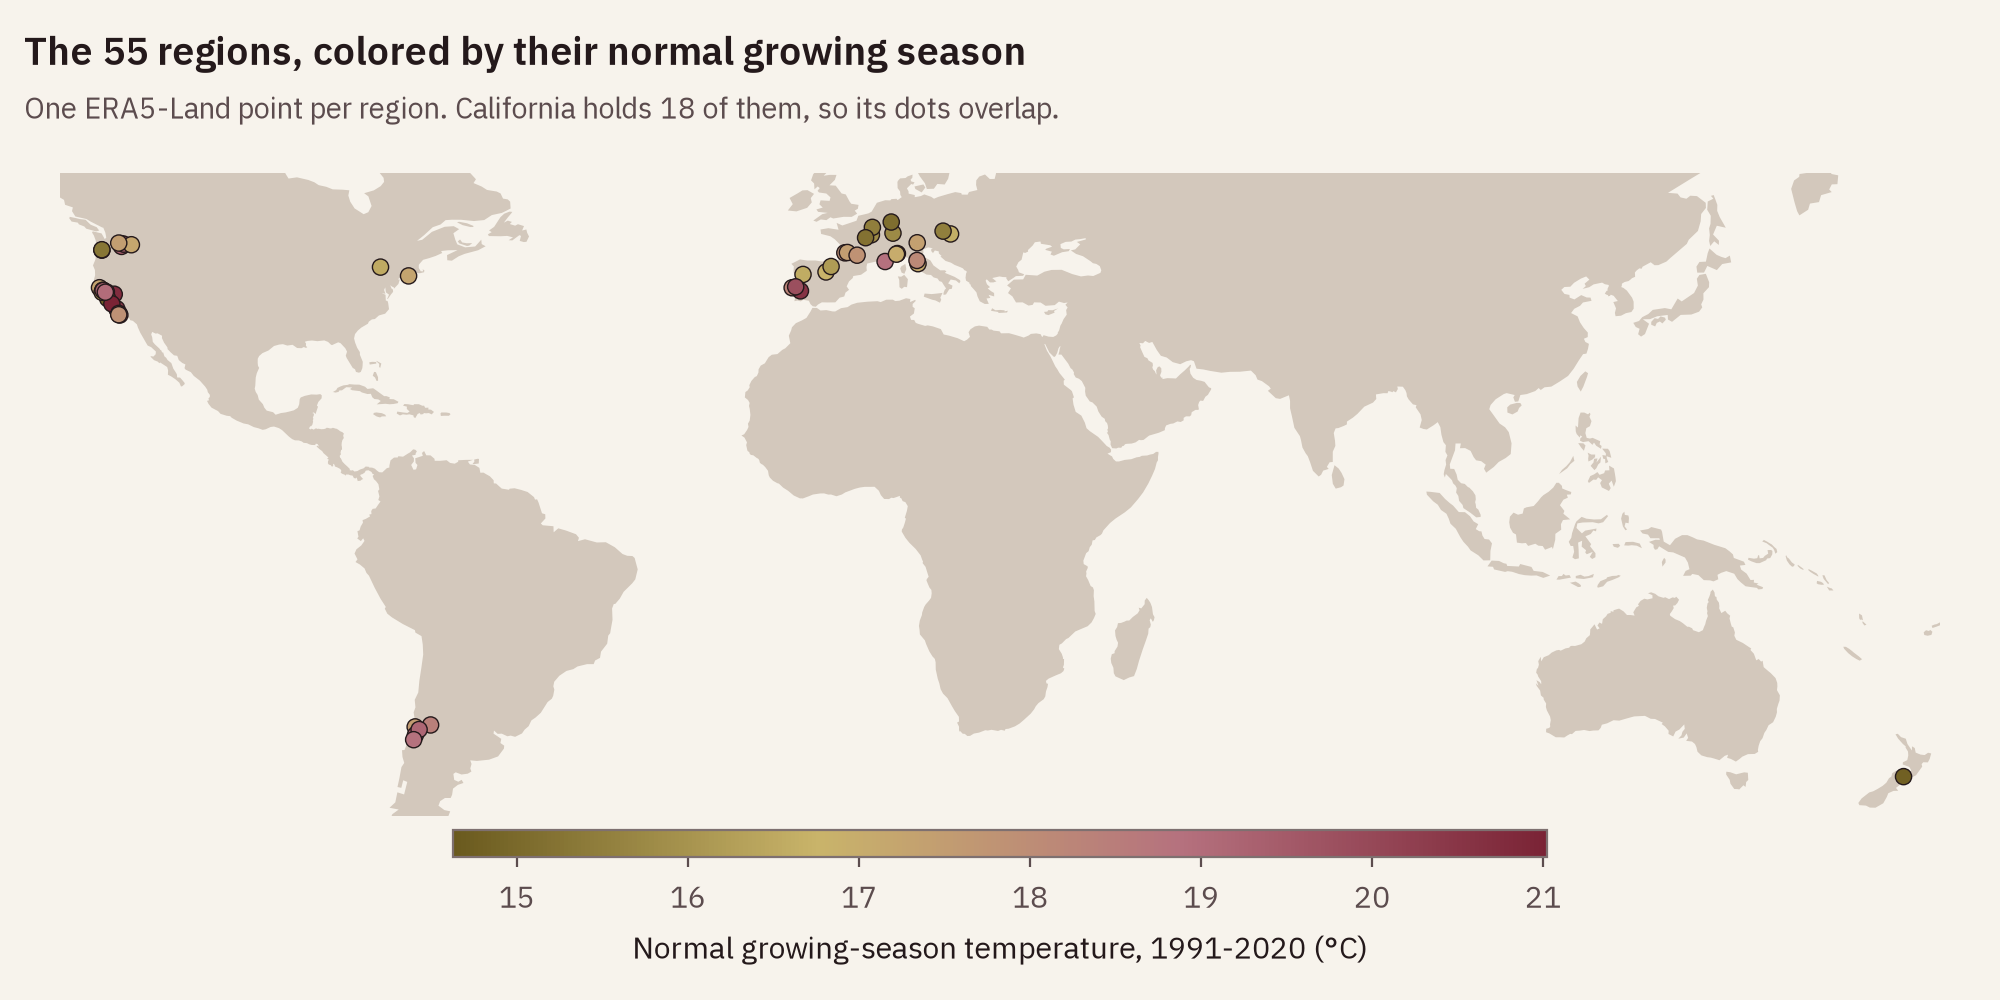
The reviews are 55,597 wines from 55 regions with at least 400 reviews and 10 vintages from 2000 to 2016, from Napa to Mosel to Marlborough. Each region has one weather point, and each season (April to October in the north, October to April in the south) is set against that point's 1991-2020 average. A season 1 °C warmer than normal means the same thing in Mosel and in Paso Robles: one degree warmer than that place usually is.
The model compares regions within the same vintage year, so anything that moved every score in a year, including the warming of about 0.40 °C a decade across these regions, is taken out. It also holds variety and taster fixed. 17 °C is the line Jones (2006) draws between intermediate and warm wine climates.
Second
Cool places gain a little more, and no group loses significantly
Below 17 °C, a degree of extra warmth added +0.24 points; above it, +0.08. The difference, −0.16 points, could easily be chance (p = 0.16). Split into Jones's four bands, the estimates run +0.24 (cool, only 3 regions), +0.25 (intermediate), 0.00 (warm) and +0.18 (hot): there is no steady decline from cool to hot, the warm band is flat (p = 0.99), and no band shows a significant negative effect. Harvest rain, which Ashenfelter and colleagues found decisive in Bordeaux, moved scores by −0.04 points per 100 mm (p = 0.55).
On a scale where the scores have a standard deviation of 3.1 points, a typical season anomaly of 0.60 °C shifts a cool region's scores by about +0.15 points. That is real at the margin and invisible on a shelf.
Third
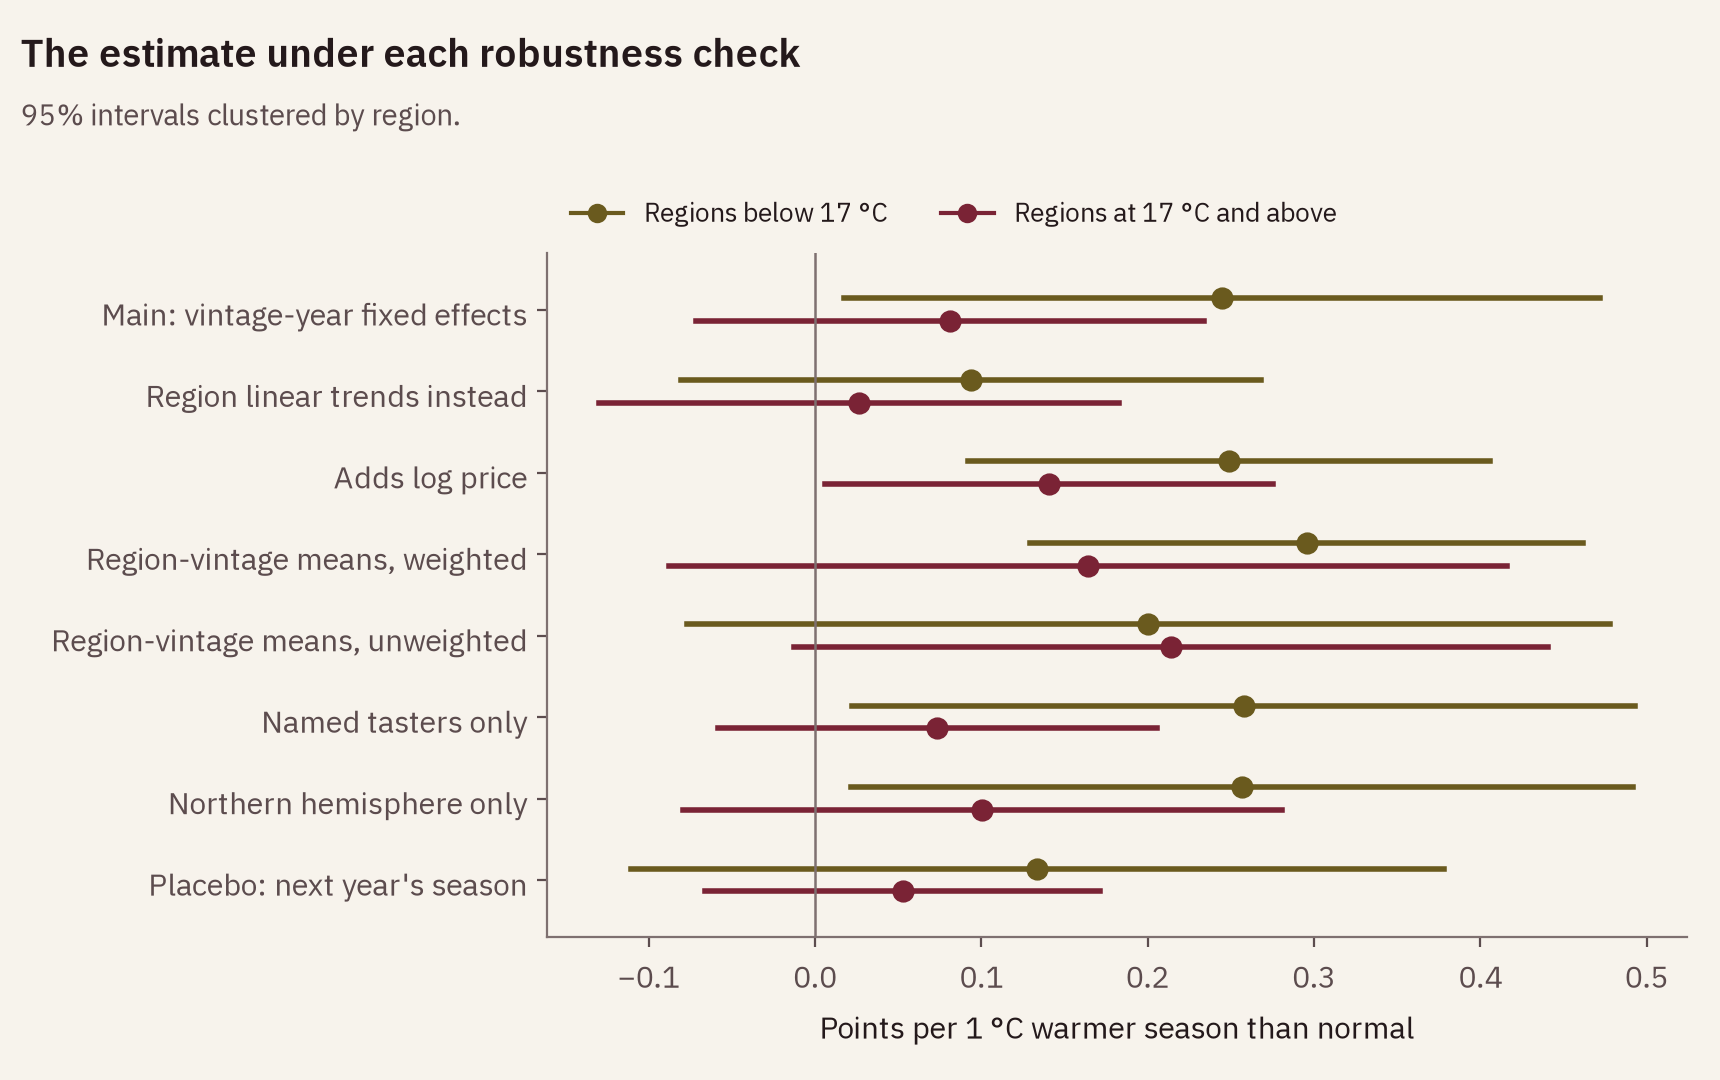
The checks weaken it
The following year's weather cannot change a wine, so it should predict nothing. It gives +0.13 points in the cool group (p = 0.28), about half the real estimate. That is not significant, but it suggests some of the real estimate may come from regions trending together rather than from the season itself. Replacing the year effects with a separate linear trend for each region shrinks both estimates to +0.09 and +0.03, neither significant. On the reviews that carry a price, adding log price moves the cool estimate from +0.28 to +0.25 and the warm one from +0.09 to +0.14. If price carried a vintage's reputation, controlling for it should shrink both; the cool one falls a little and the warm one rises, so price does not explain the effect away. Averaging to one number per region and vintage reverses the order of the two groups when the cells are unweighted.
What it adds up to
Warm seasons nudge critics' scores up, more clearly in cool regions than warm ones, but the effect is a fraction of a point, weather explains 0.08% of what is left after region, year, variety and taster, and the estimate does not survive every reasonable specification. The question was whether the effect flips sign between cool and warm places. In these 55 regions over 2000 to 2016 there is no significant negative effect in any group, though that is weak evidence against a small one.
Limitations
- Tasters are not blind to vintage. A score can carry the vintage's reputation, so this measures what critics scored, not what a blind panel would.
- Wine Enthusiast reviews what producers submit. A weak vintage may be under-submitted, which would shrink measured differences.
- There is no review date, so the lag between vintage and tasting is unknown and differs by style.
- One reanalysis grid point stands in for each region's vineyards and slopes. Rain comes from ERA5 at a coarser grid than the ERA5-Land temperatures, because Open-Meteo serves no ERA5-Land rain.
- Taster and region are close to confounded: in 22 of the 55 regions one taster wrote more than 90% of the reviews.
- Scores sit in a narrow band (mean 88.8, standard deviation 3.1), and nothing below 80 is published, so every effect here is squeezed into a few points.
- Only 3 regions fall in Jones's cool band, and with that few clusters its interval should not be trusted.
- Band assignment depends on one grid point per region. ERA5-Land puts Carneros (19.4 °C) and Russian River Valley (19.1 °C) in the hot band, though both are usually called cool AVAs, and the Douro point (Alijó, 609 m) sits above most Douro vineyards. The elevation check compared each point with its town's elevation, not the vineyards' as the project spec asked.
Data and method
129,971 Wine Enthusiast reviews from the public winemag-data-130k-v2 set; temperatures from ERA5-Land and harvest rain from ERA5, both through the Open-Meteo archive. Review-level regression of points on the season temperature anomaly (by climate group) and the harvest-rain anomaly, with region, vintage-year, variety and taster fixed effects and standard errors clustered by region. Every number on this page is written by the code in the repo; the write-up has the full method and every check.
Sources
- Ashenfelter, O., Ashmore, D. and Lalonde, R. (1995). Bordeaux wine vintage quality and the weather. Chance 8(4), 7-14.
- Jones, G. V., White, M. A., Cooper, O. R. and Storchmann, K. (2005). Climate change and global wine quality. Climatic Change 73, 319-343.
- Jones, G. V. (2006). Climate and terroir: impacts of climate variability and change on wine. In Fine Wine and Terroir: The Geoscience Perspective, Geoscience Canada Reprint Series 9.
- Muñoz-Sabater, J. et al. (2021). ERA5-Land: a state-of-the-art global reanalysis dataset for land applications. Earth System Science Data 13, 4349-4383.
- Weather data by Open-Meteo.com (CC BY 4.0).