Data story · ~130,000 wine reviews
Wine Score Inflation
Wines are rated on a "100-point scale." So why does it feel like everything scores around 90? I ran the numbers on 130,000 professional reviews.
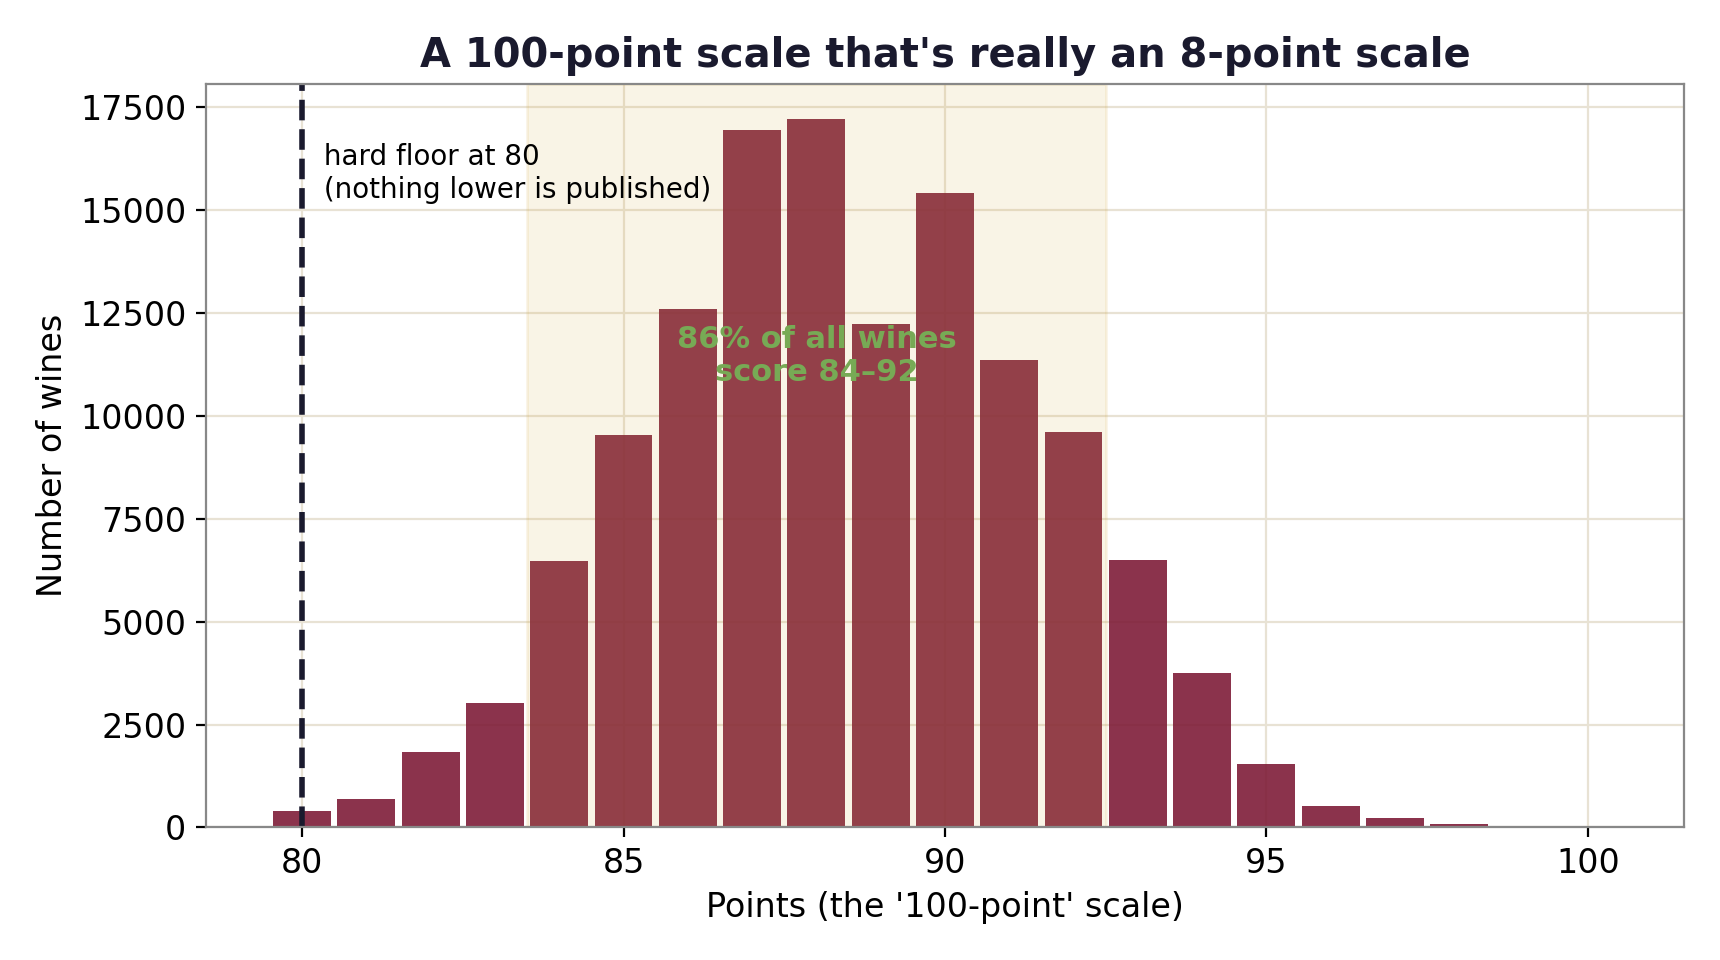
A 100-point scale that's really an 8-point scale
Wine is scored from 50 to 100, but in practice that scale barely exists. Across ~130,000 Wine Enthusiast reviews, nothing is published below 80, the average is 88, and 86% of all wines fall between 84 and 92. Almost the entire "100-point" range is dead space. When failing grades are never printed and everything clusters in an 8-point band, a high score stops meaning much.
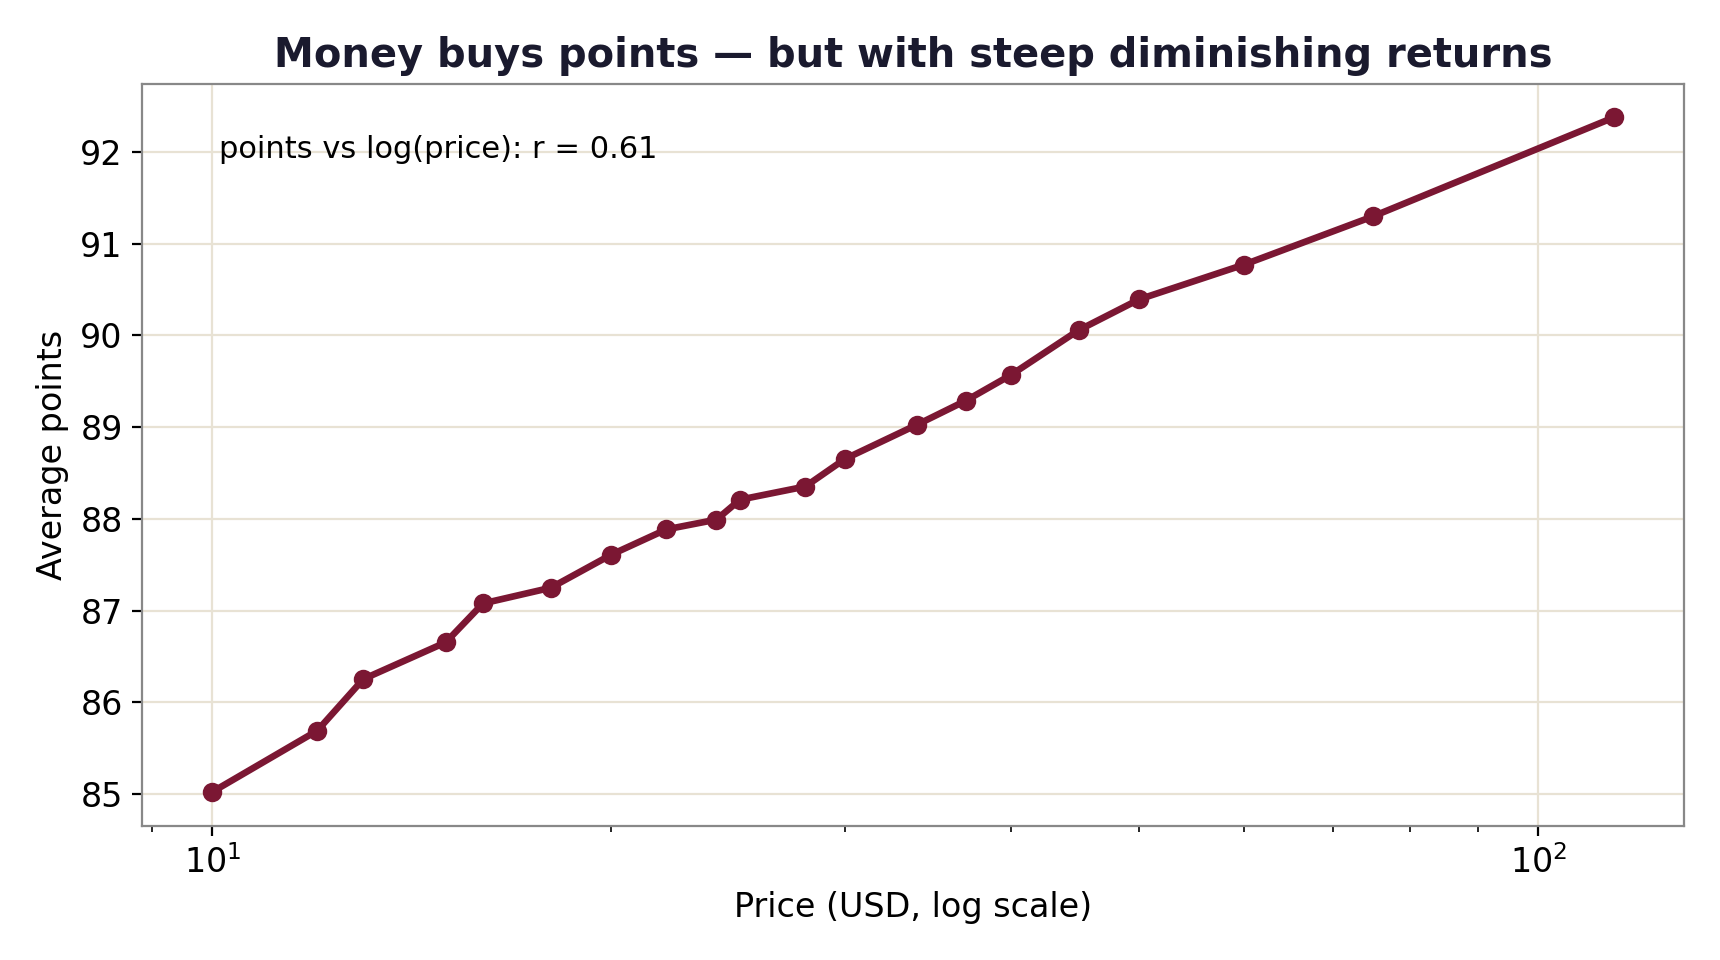
Money buys points, with steep diminishing returns
Price and score are related (correlation 0.61 against log-price), but you pay dearly for each point. A roughly $10 wine averages about 85 points; a $100 wine averages about 92. Spending ten times as much buys you, on average, about seven points, and most of those points come early.
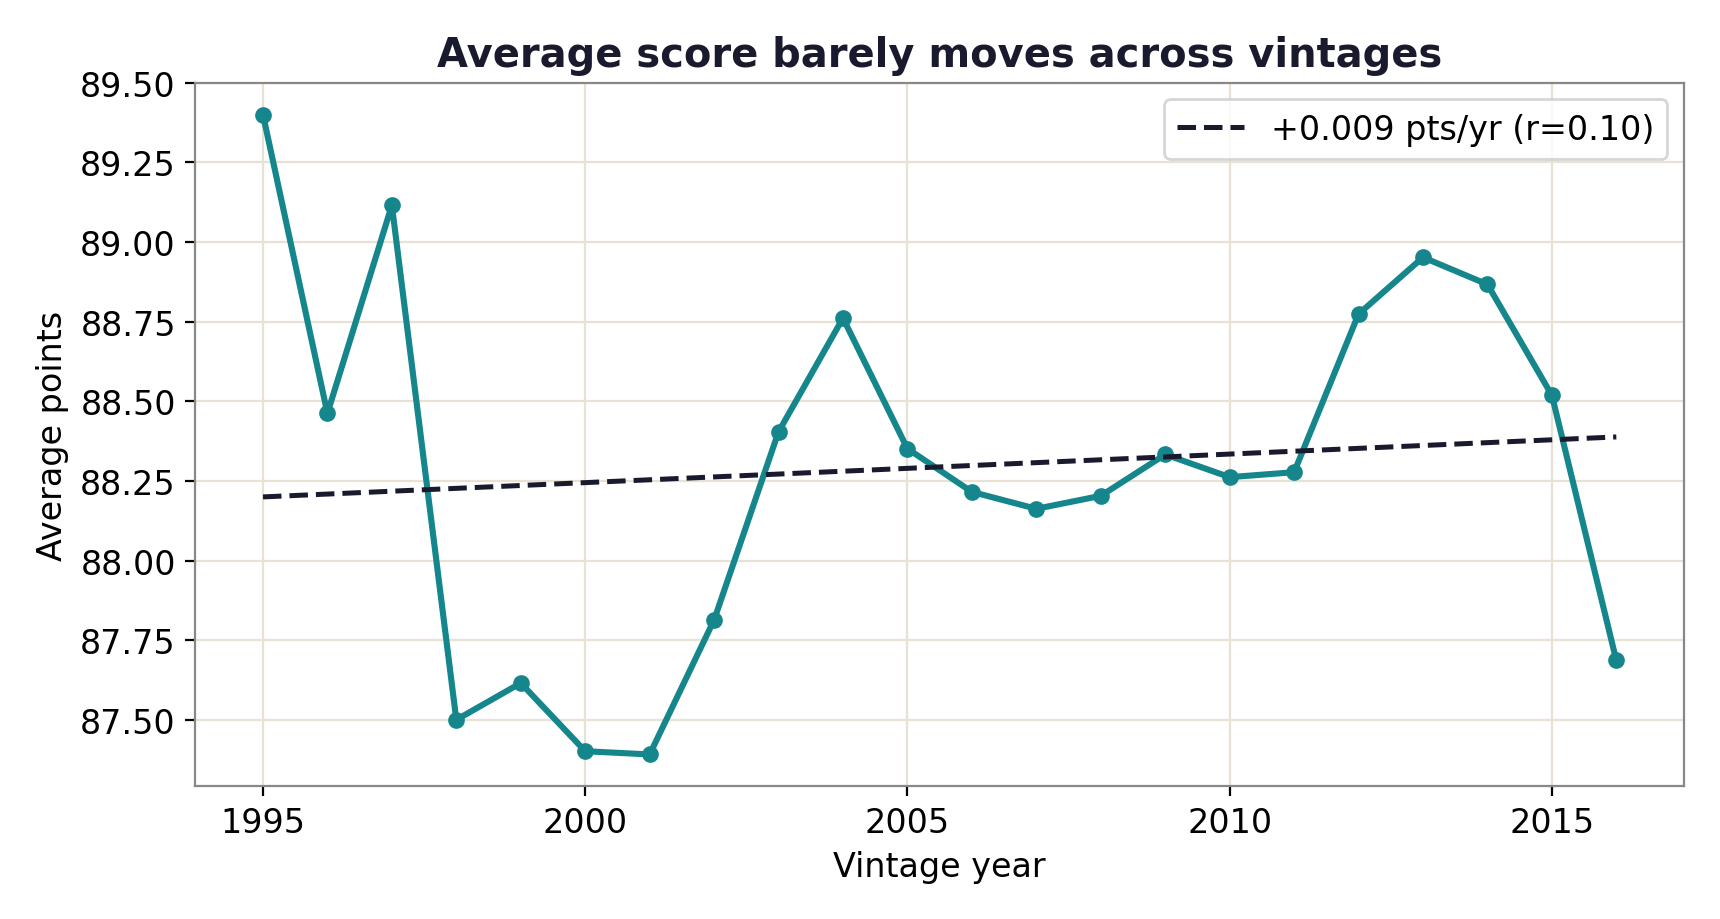
It's not a "recent vintages are better" effect
You might guess the scores have crept up over time. They haven't: average points are essentially flat across vintages (about 0.09 points per decade). The compression isn't a recency trend. It's baked into how the scale is used.
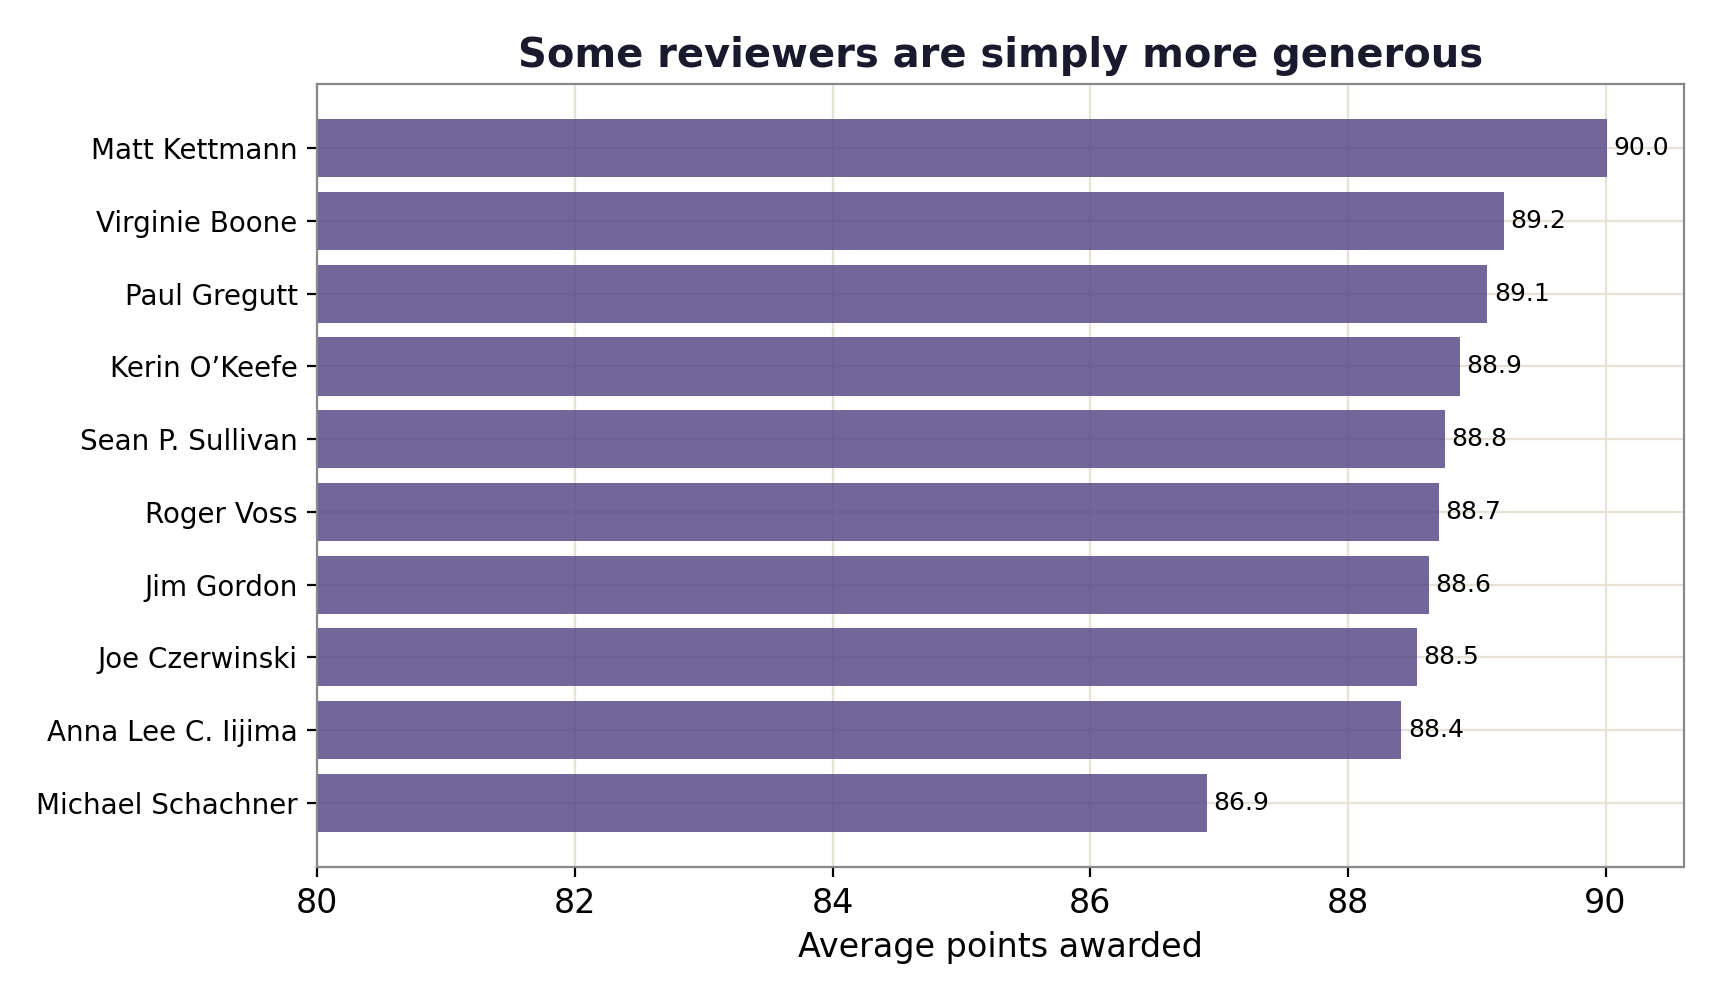
The reviewer matters as much as the wine
Who tastes the wine moves the number. Among the most prolific reviewers, average scores range across 3.1 points, roughly the same boost you'd get by paying ten times more for the bottle.
The findings
- Scores are floored at 80 and 86% land in 84–92: the 100-point scale is effectively ~8 points wide.
- Points track log-price (r = 0.61) with steep diminishing returns: ~$10 → ≈85 pts, ~$100 → ≈92 pts.
- Average score is flat across vintages (~0.09 pts/decade). The compression is structural.
- The reviewer adds a 3.1-point spread, as much as a 10× price jump.
What to do with a wine score
Treat the number as a coarse signal, not a verdict. The gap between an 88 and a 90 is mostly noise: vintage, reviewer, and rounding. If you're hunting value, the early part of the price curve is where the points are cheapest, which is exactly the thread I pull on in my New World vs Old World wine value work.
fetch_data.py + analyze.py in the repo.