Start · the question
What does 92 points actually mean?
Wine scores are treated as an absolute measure. A 92 on the shelf tag is read as "92 out of 100," which implies there is a 62 out there somewhere and that this wine is comfortably above the middle. Both implications are wrong, and the size of how wrong is worth measuring.
The public winemag dataset makes it checkable: about 130,000 reviews, each with a score, a price, a vintage, and the taster who wrote it. That is enough to ask what the scale actually does, what price buys, and how much of a score is the wine versus the person drinking it.
↓ the shape of the scale
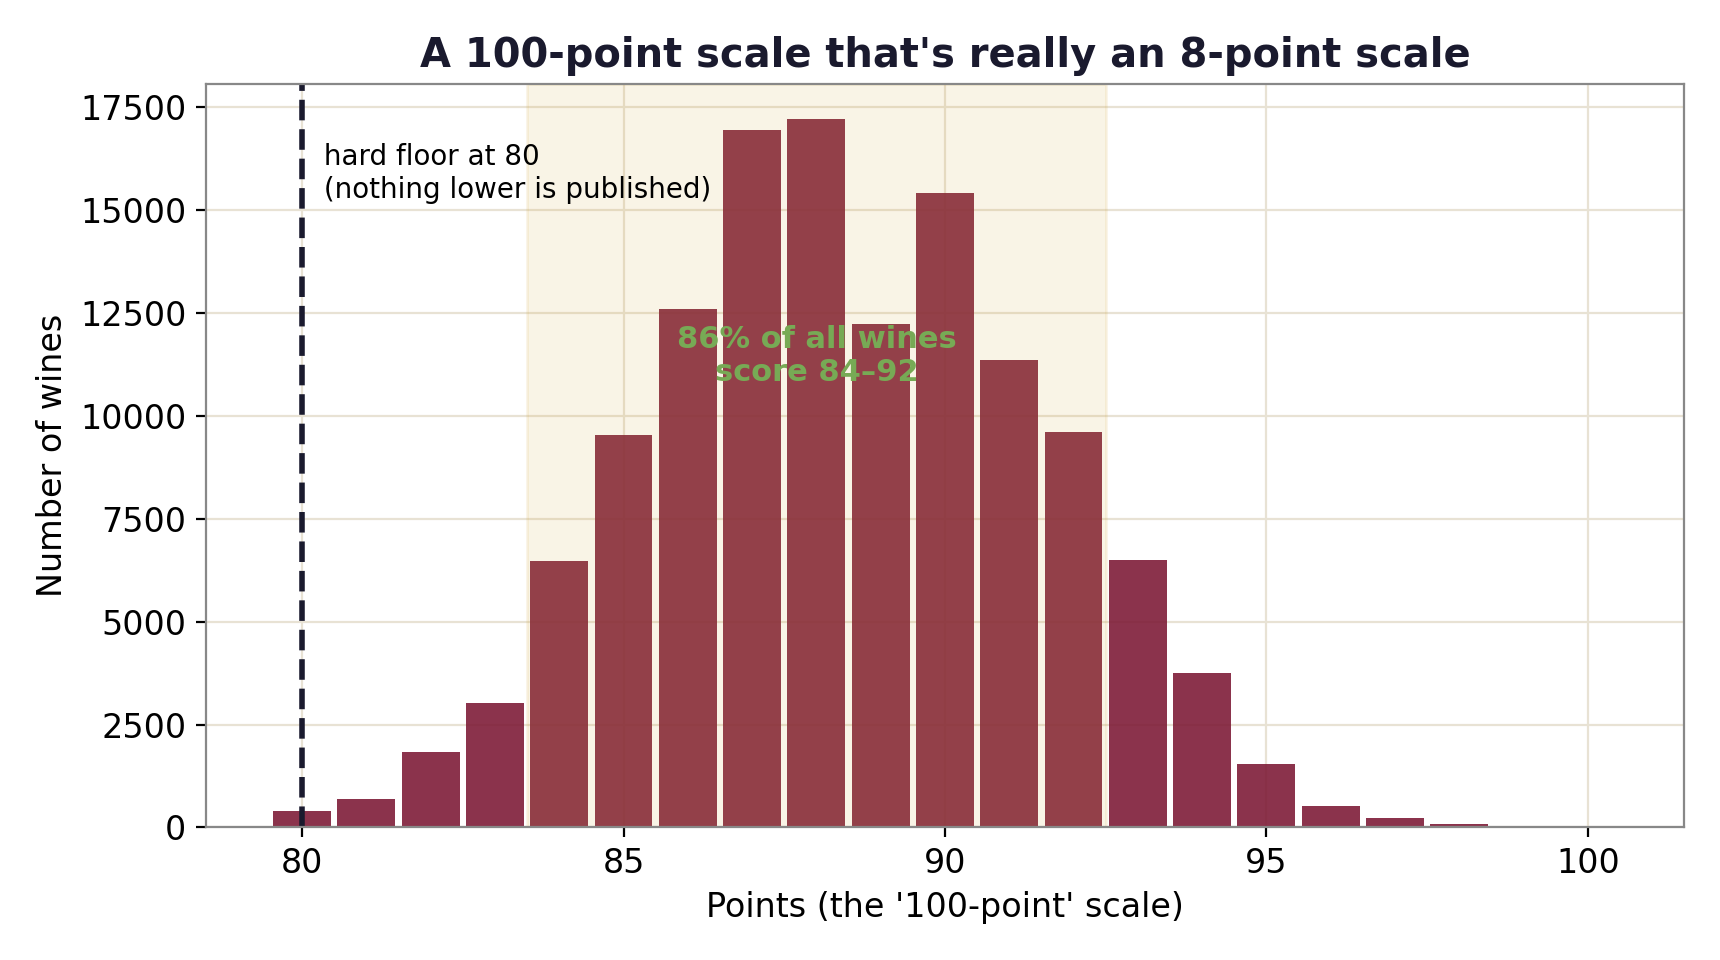
A floor at 80 and a spike in the middle
the effective width of a scale advertised as 100 points.
The distribution is not a bell curve spread across a hundred points. It is a narrow hump sitting on a cliff. Nothing below 80 is published at all, which is a publishing decision rather than a fact about wine, and the mass piles up between 84 and 92.
This is the structural version of "inflation." No year-over-year creep is needed for the scale to be useless at the bottom; it simply never uses the bottom.
↓ what money buys
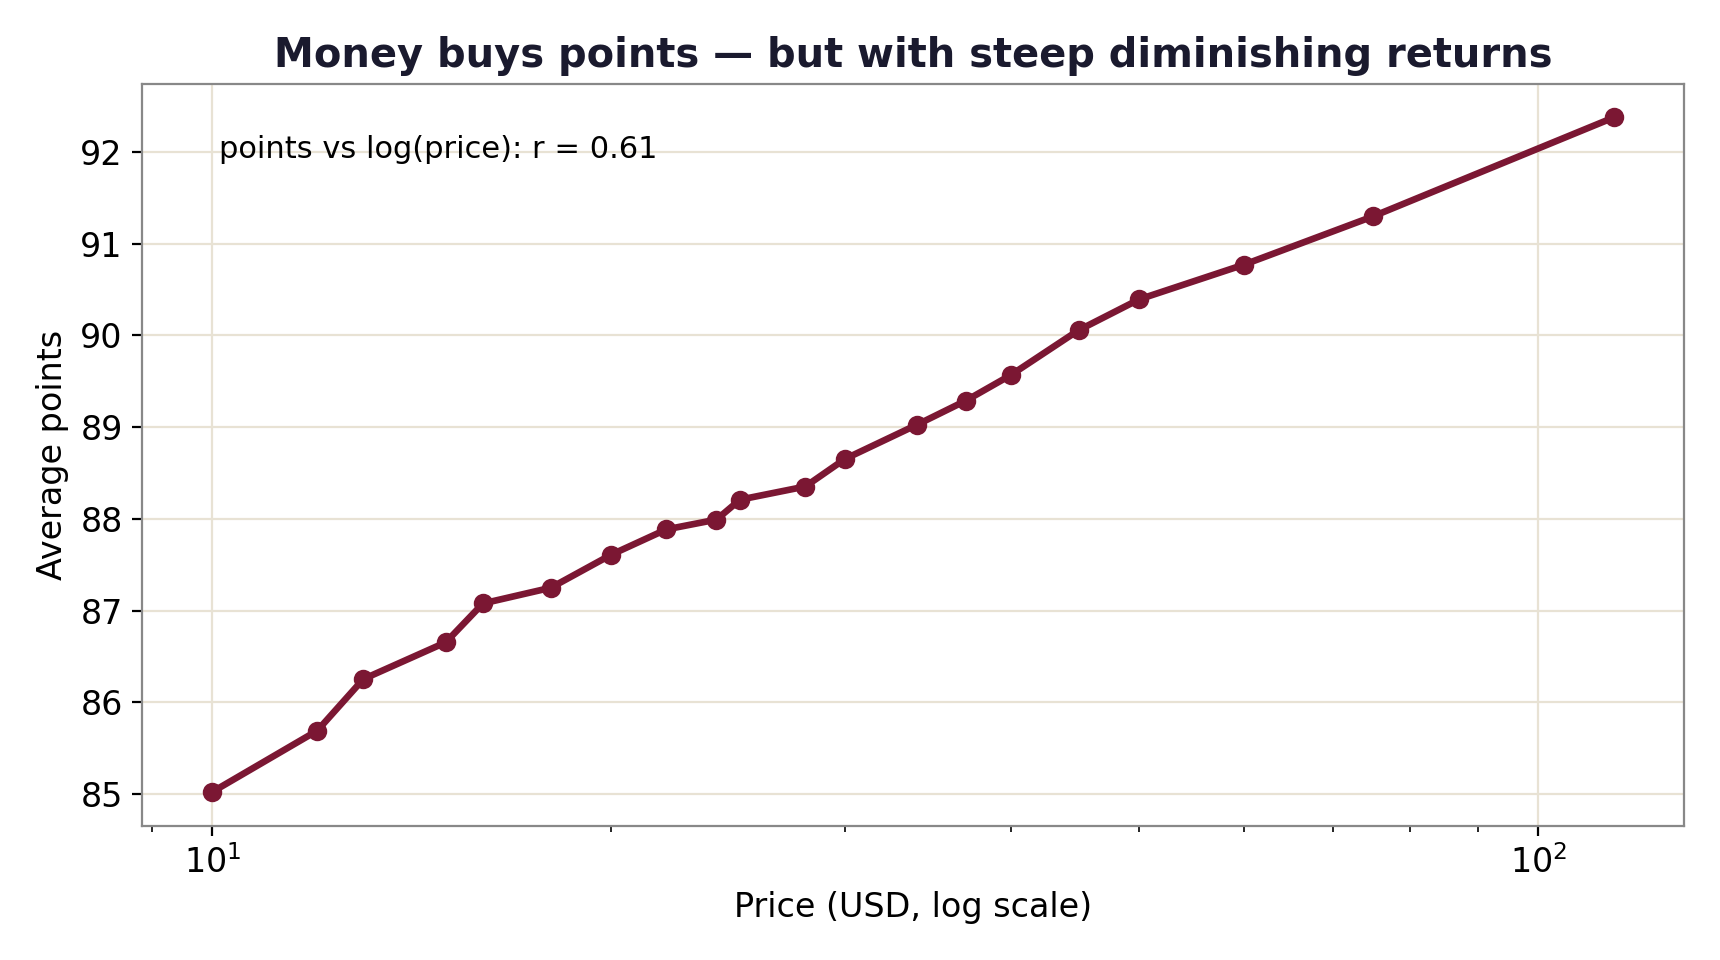
Price works, logarithmically
Expensive wine does score better, and the relationship is strong for something this noisy: r = 0.61 against log price. But the log is the story. Going from $10 to $100 — a tenfold increase — moves the expected score from about 85 to about 92, roughly seven points. The next tenfold buys far less.
Read the other way, the cheap end of the market is where the points-per-dollar lives, and nothing in this data suggests a $400 bottle is meaningfully better rated than a $100 one.
↓ two things that should matter and don't
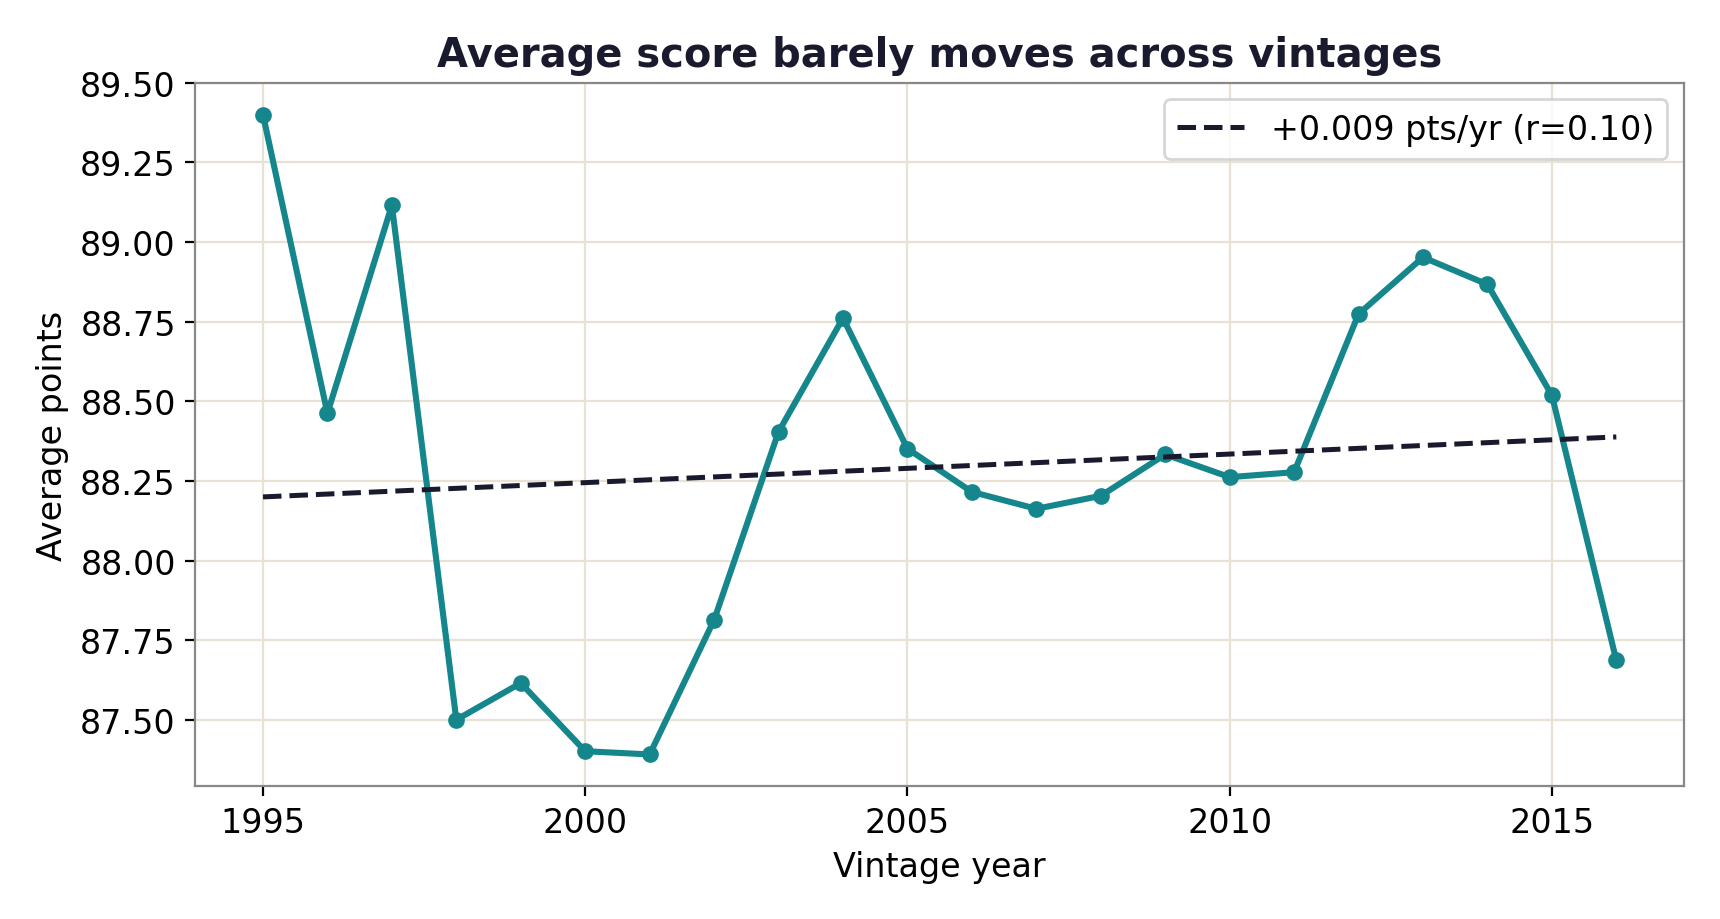
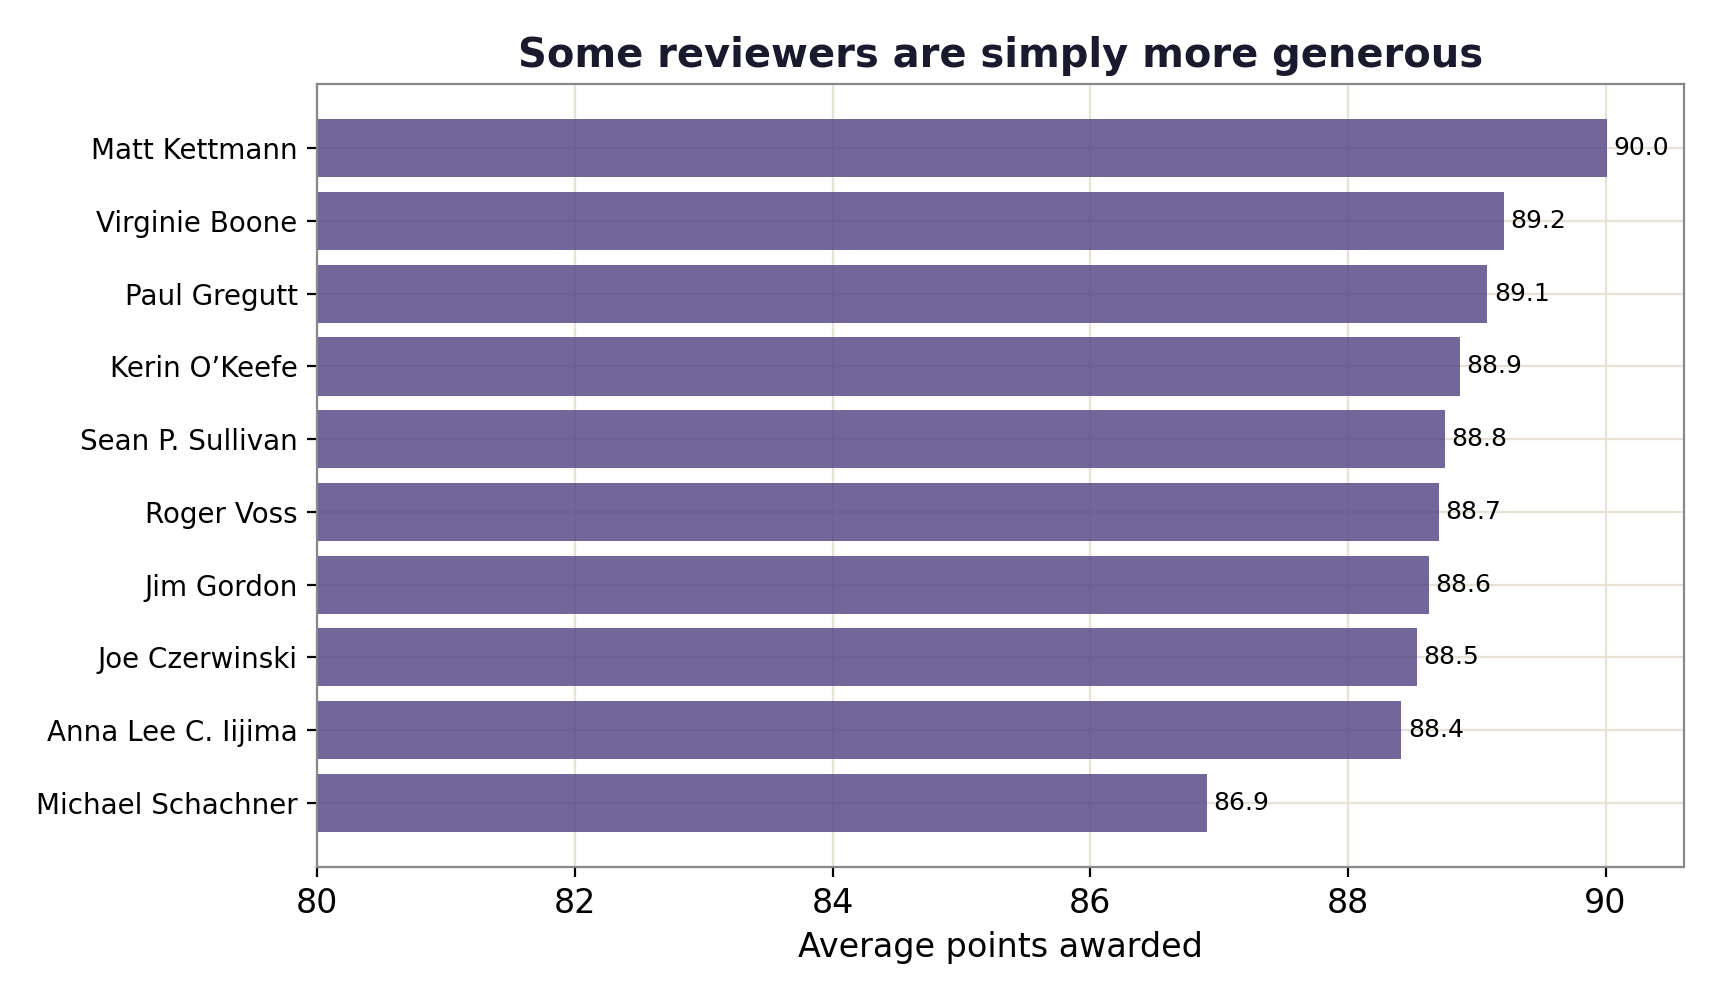
Vintage barely moves. The taster moves a lot.
Average score by vintage is essentially flat, drifting about 0.09 points per decade. Whatever people mean by good and bad years, it does not show up in the mean of a large catalogue.
Reviewers, by contrast, differ by 3.1 points between the most and least generous. On a scale that is genuinely about eight points wide, that gap is a third of the whole usable range, from nothing but a change of author.
↓ what this cannot tell you
One publication, one snapshot
Everything here comes from a single snapshot of a single magazine. That matters most for the word "inflation." Because the data carries no review date, this cannot measure scores creeping upward year over year, which is what most people mean by the term.
What it measures instead is the structural version: an 80 floor, a compressed band, and a scale whose advertised range is mostly fiction. That is a real and separate finding, and the page says which one it is rather than letting the headline imply the other.
Vintage is parsed out of each wine's title, so a small number of titles that do not carry a year are simply absent from that chart rather than guessed at.
Finish · how it was built
Where the numbers come from
- Data
- The public
winemag-data-130k-v2Wine Enthusiast dataset, via a GitHub mirror - Sample
- ~130,000 reviews with score, price, title and taster
- Price model
- Points against log price, since the raw price distribution is extremely skewed
- Vintage
- Parsed from the wine title; rows without a parseable year are dropped from that view only
- Built with
- Python, pandas, matplotlib
- Related
- The same 130k reviews become a retrieval index in Wine Sommelier RAG and the search tool inside the Wine Pairing Agent