Start · the framing
The obvious analysis is the wrong one
The tempting approach is to average how long past records lasted. It gives a number, and the number is wrong, because it can only see records that have already been broken. Every record still standing — which is to say every record anyone actually cares about — is excluded by construction, and those are precisely the long-lived ones.
Survival analysis exists for this. A record still standing is censored: we know it has lasted at least this long and not how much longer it will go. Kaplan-Meier uses that partial information instead of discarding it.
↓ the curve
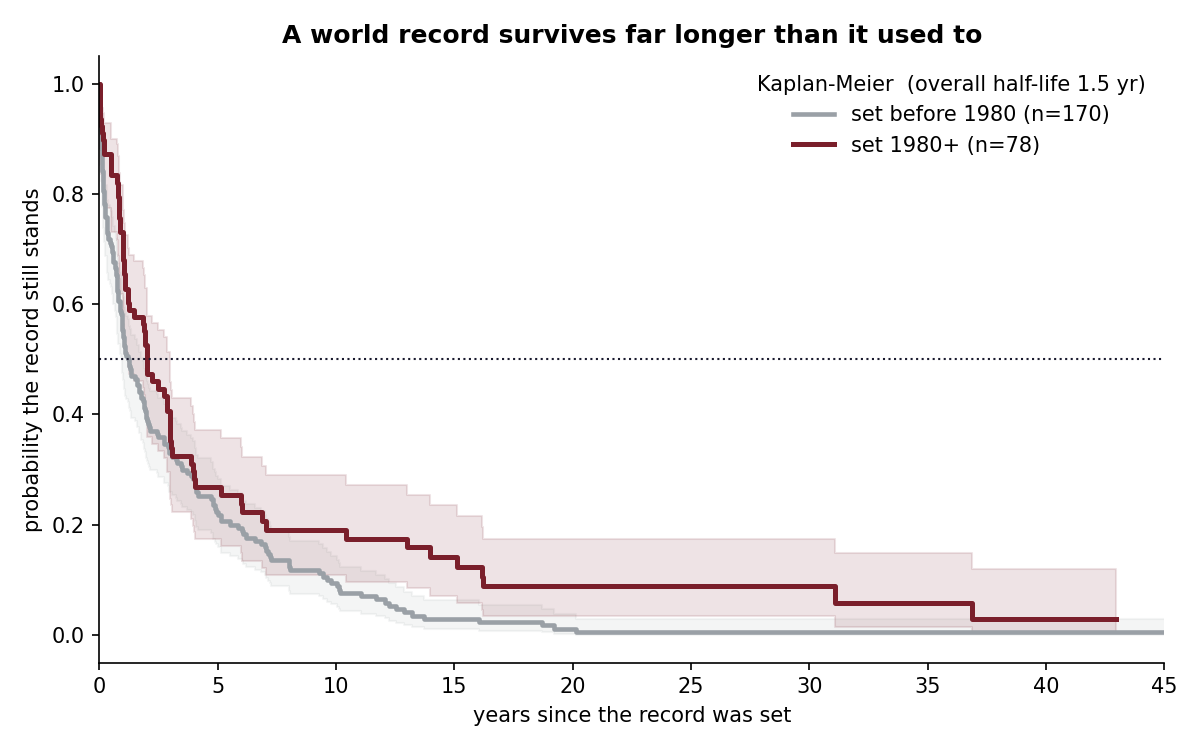
Most records die young
median survival of a world record, across nine events.
The hazard is front-loaded. A new record is at its most vulnerable almost immediately, because the conditions and the athlete that produced it are usually still around. Survive that window and the curve flattens dramatically.
Which reframes the famous old records. They are not durable because something special happened in 1983; they are durable because they cleared the dangerous first years, and the survivors are the ones we remember.
↓ what makes one last
Two things predict durability
The Cox model finds both effects pointing the same way, and both are intuitive once stated.
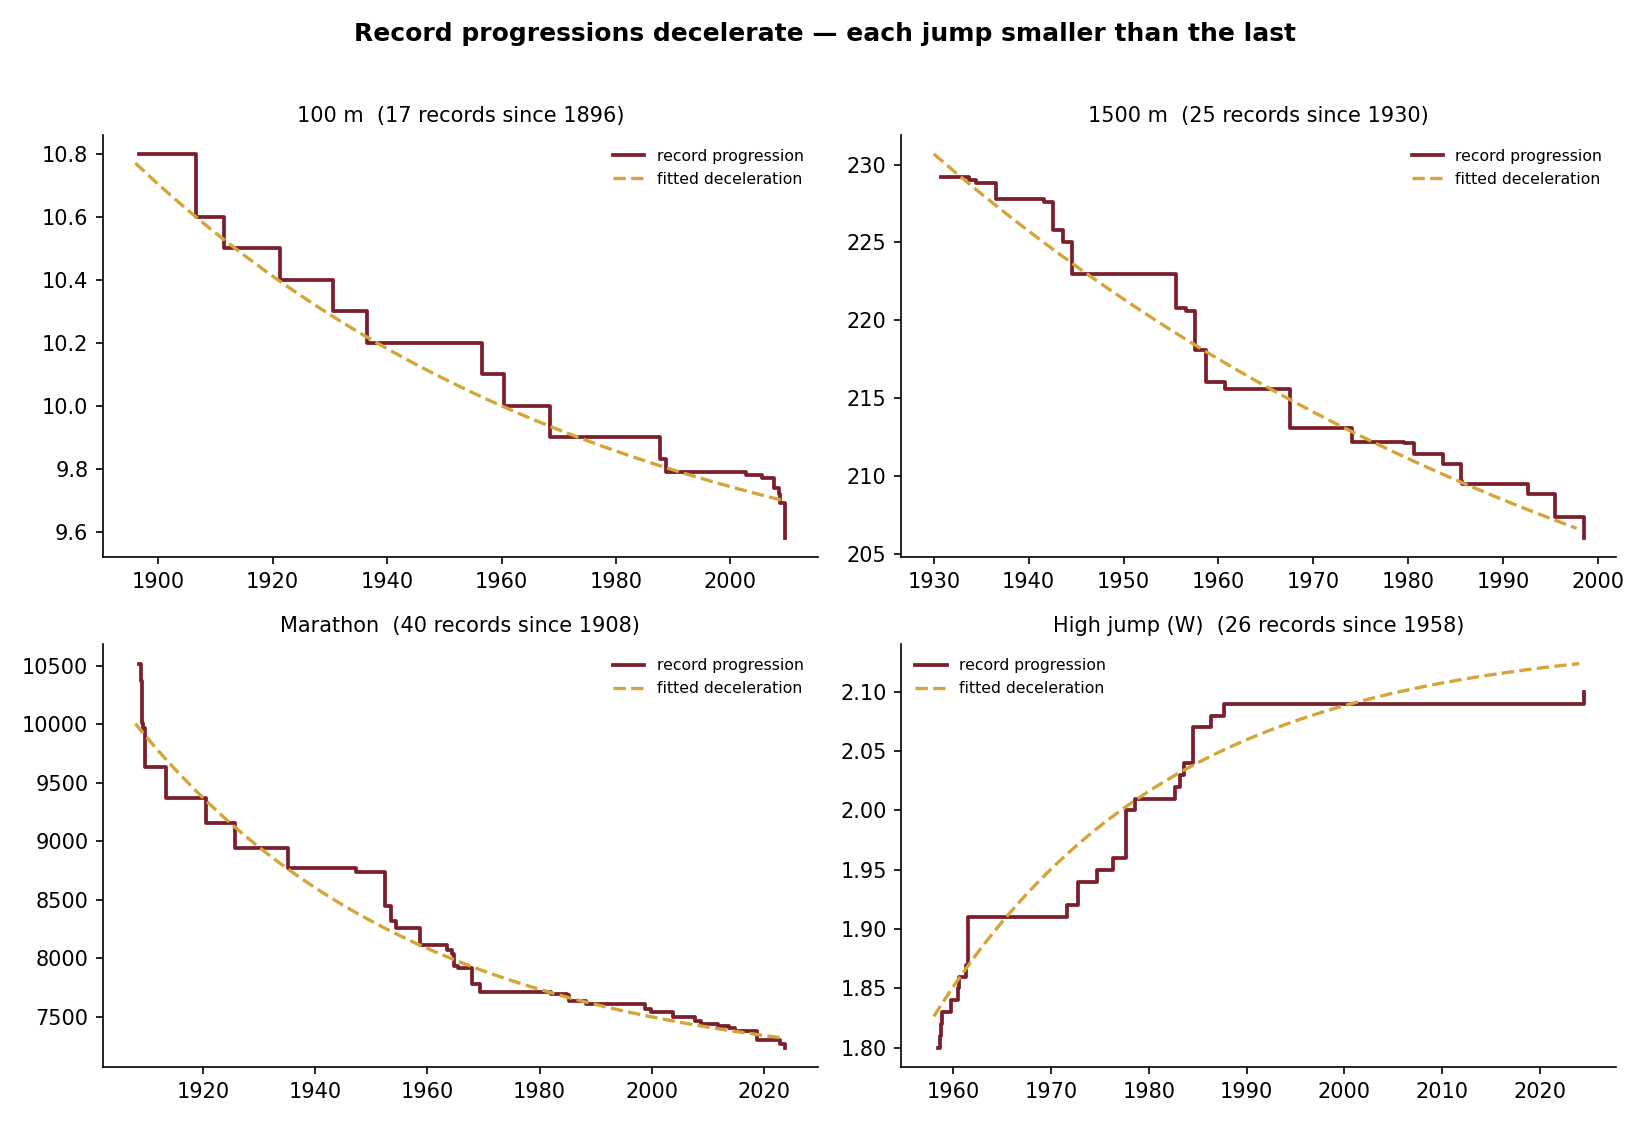
Modern records last longer. A record set in 1980 or later carries a hazard ratio of about 0.52 — roughly half the risk of falling in any given year. The sport got professional, the low-hanging improvements were taken, and the frontier got harder to move.
Big leaps last longer. Each unit of improvement in the jump that set a record carries a hazard ratio of about 0.65. A record that beat its predecessor by a wide margin has put clear air between itself and the field, and that air takes years to close.
↓ today
Which record falls next
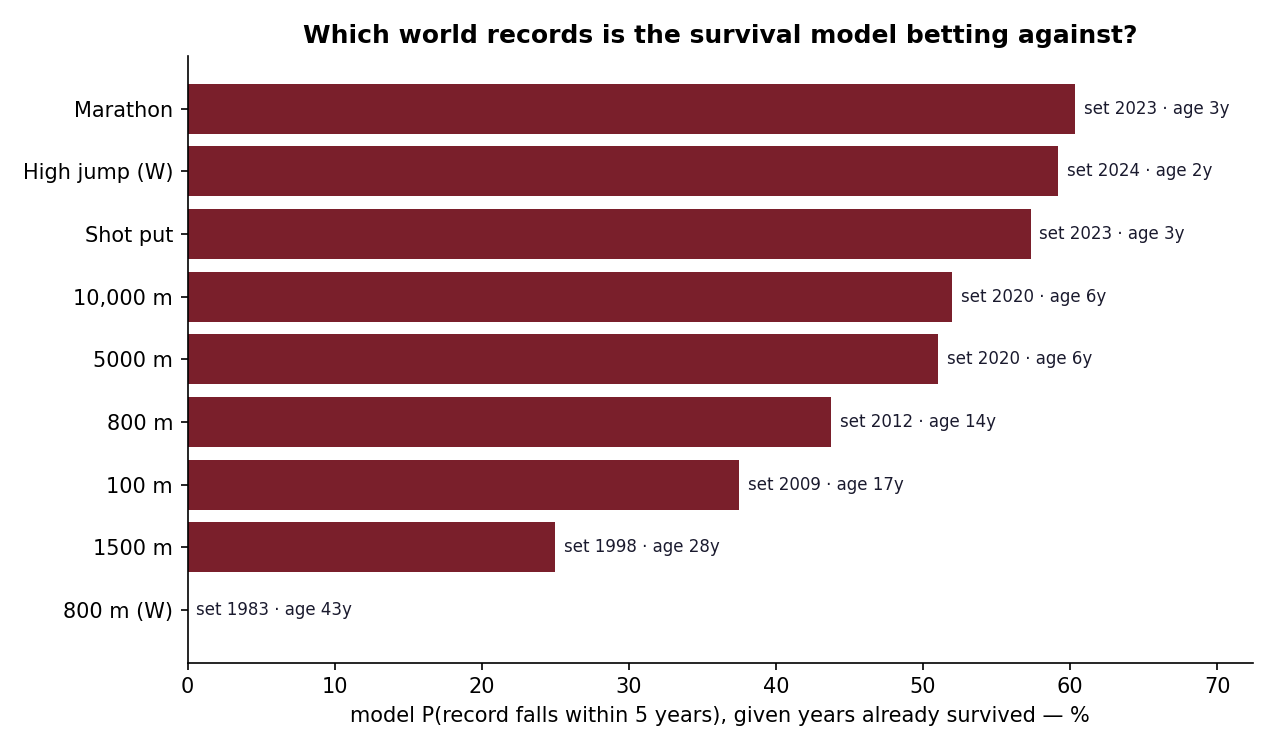
Turn the model on the records standing right now, conditioning on how long each has already survived, and the five-year fall probabilities spread across the entire range. The 2023 marathon record sits near 60%, which fits an event mid-way through a shoe-driven rewrite — a shift I decomposed separately in the super-shoe study. The women's 800 m from 1983 sits near zero.
↓ the data problem, and what was done about it
Nine events, because only nine verified clean
Progressions come from Wikipedia's record-progression pages, which mix the actual chronological progression with all-time top lists and navigation boxes. A naïve scrape silently truncates or contaminates an event's history, and nothing about the output looks wrong when it does.
So the fetcher applies a hard completeness check: an event is kept only if its reconstructed running-best equals the current ratified world record and its history reaches far enough back. Nine events pass — 100 m, 800 m, 1500 m, 5000 m, 10,000 m, marathon and shot put for men, plus the women's 800 m and high jump. Everything else is dropped rather than analysed half-complete.
Two limits remain. The model sees when records fell but not the live pressure on them, so it has no idea how many athletes are within 1% today — the obvious next feature. And event "limits" from asymptotic curve fits are left out of the headline entirely, because for still-improving events the asymptote is not statistically identifiable and would be a confident-looking guess.
Finish · how it was built
Where the numbers come from
- Data
- Wikipedia world-record progression pages, read with
pandas.read_html - Verification
- An event is kept only if its reconstructed running-best matches the current ratified record
- Sample
- ~250 record reigns across nine verified-complete events
- Models
- Kaplan-Meier for survival, Cox proportional hazards for covariates
- Censoring
- Records still standing are right-censored, not dropped
- Built with
- Python, pandas, lifelines, matplotlib
- Tables
record_reigns.csv,cox_summary.csv,current_record_vulnerability.csv