Start · the question
Good advice, or advice nobody can take?
Hold back early, finish faster, run your best time. Every training plan says it. The advice is sound, and the physiology behind it is real. What I wanted was the other number, the one nobody quotes: out of thousands of ordinary runners on an ordinary race day, how many actually do it?
Boston publishes timing-mat splits for every finisher, which makes the question answerable rather than arguable. Each runner's race splits cleanly into the time to the half-marathon mat and the time from that mat to the line. If the second number is smaller, that is a negative split. No modelling, no adjustment, just subtraction across an entire field.
↓ the answer
Almost nobody speeds up
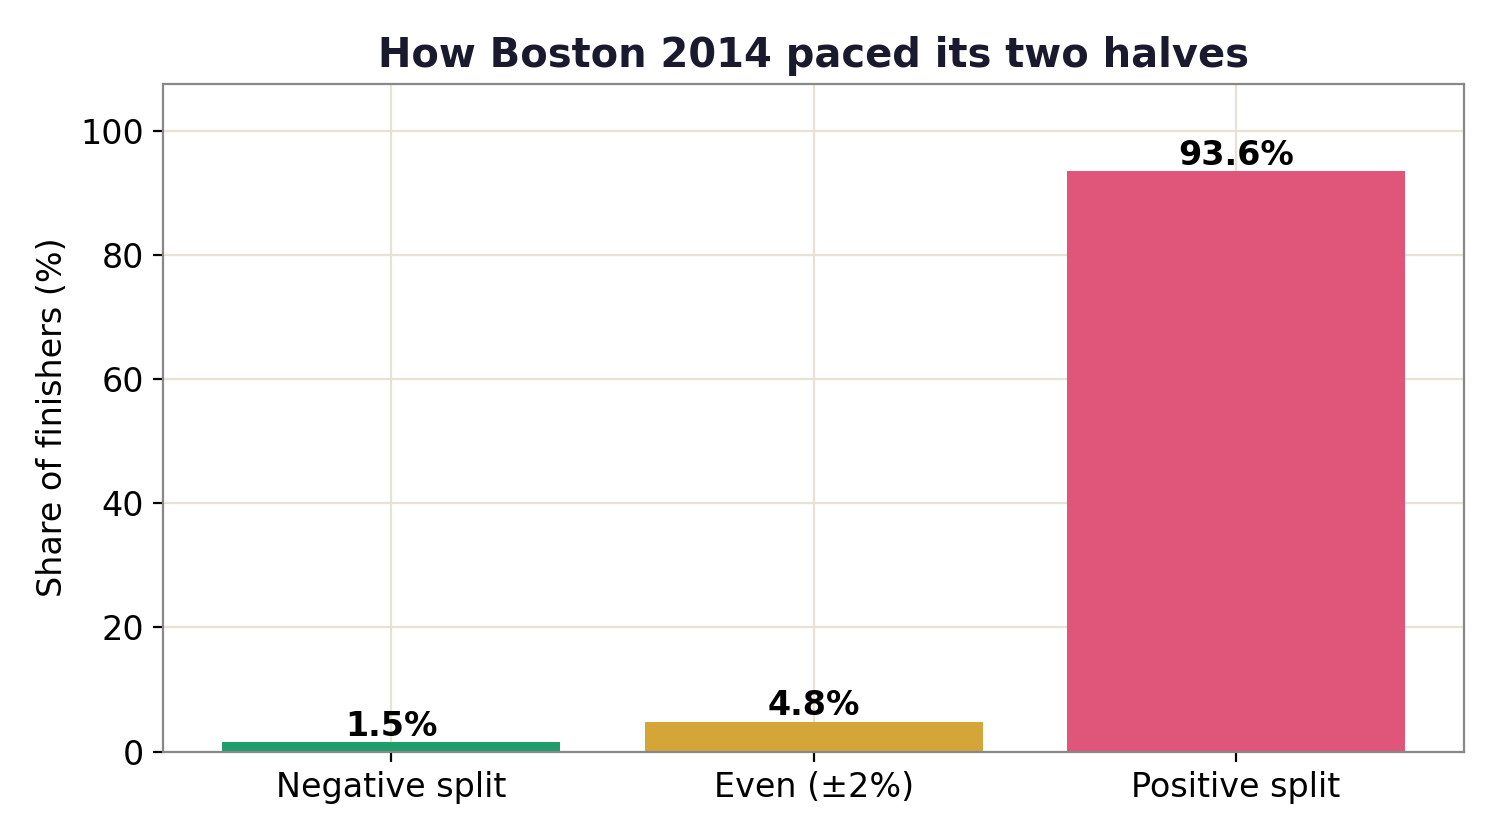
of 31,912 finishers ran the second half faster than the first.
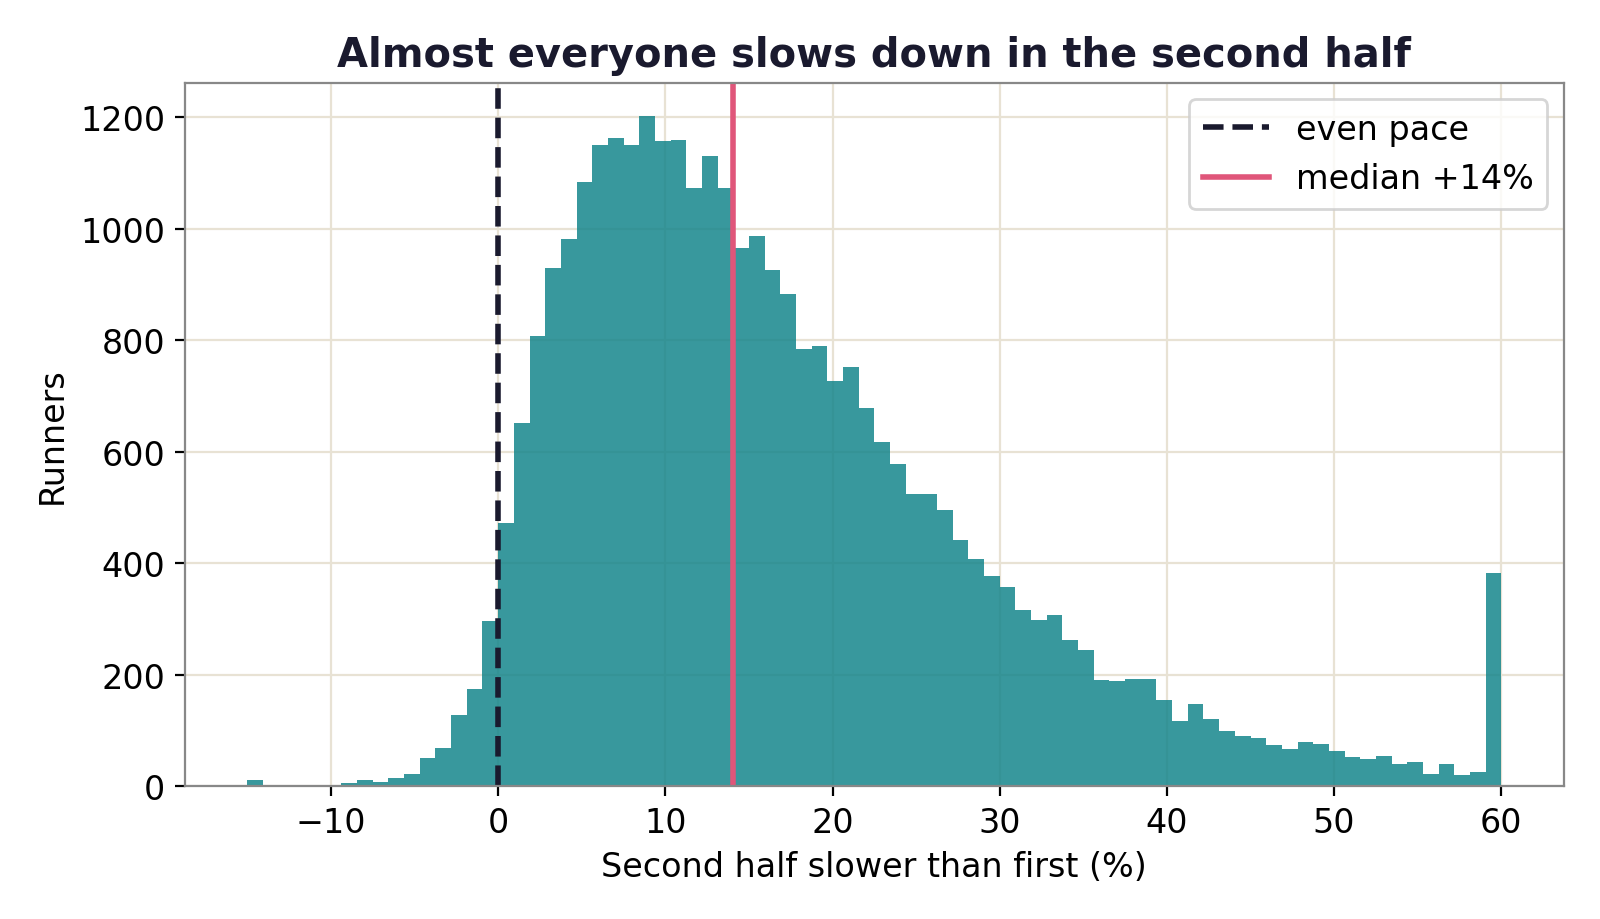
Roughly another 4% paced within 2% of even, which is close enough to call it flat. Everyone else — about 94% of the field — gave time back. This is not a story about a few people blowing up. It is what the marathon does to nearly everybody who runs one.
↓ who it separates
Even pacing is a symptom of being fast
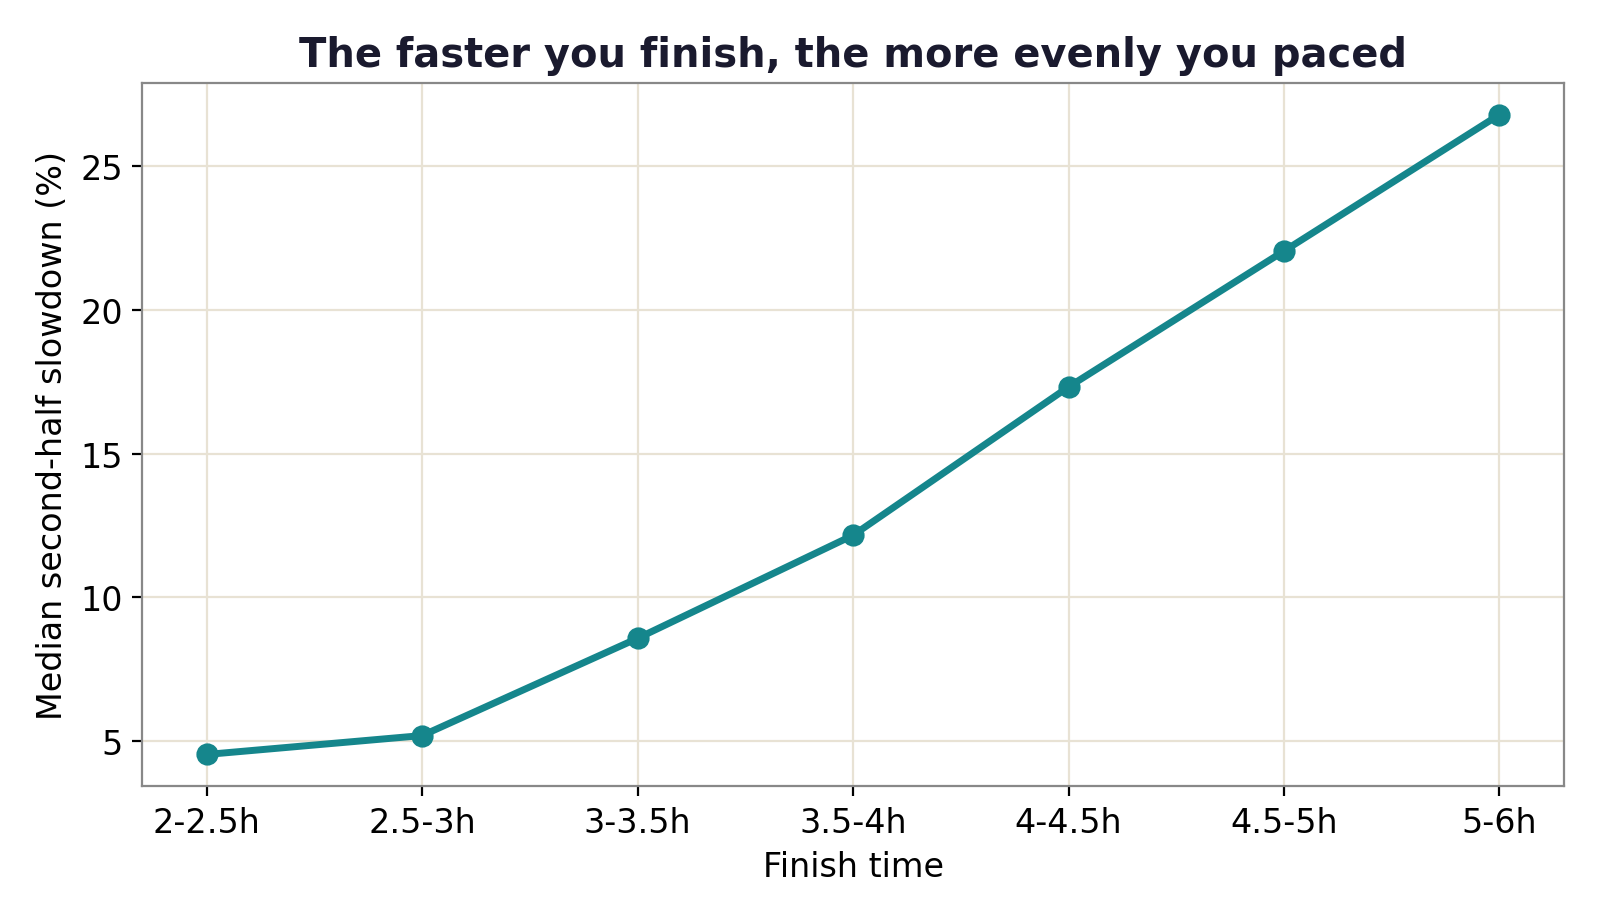
Split the field by finish time and the slowdown grows almost monotonically from front to back. The 2:00–2:30 group loses about 4.6% in the back half. The 5:00–6:00 group loses 26.8%. The curve barely moves across the first two brackets, then steepens all the way to the end of the field.
Which way the causation runs is worth being careful about. Even pacing almost certainly helps, but a lot of this gap is simply that fitter runners are further from their limit at halfway. The chart shows the association; it cannot separate the two on its own.
↓ a smaller gap
Women paced slightly more evenly
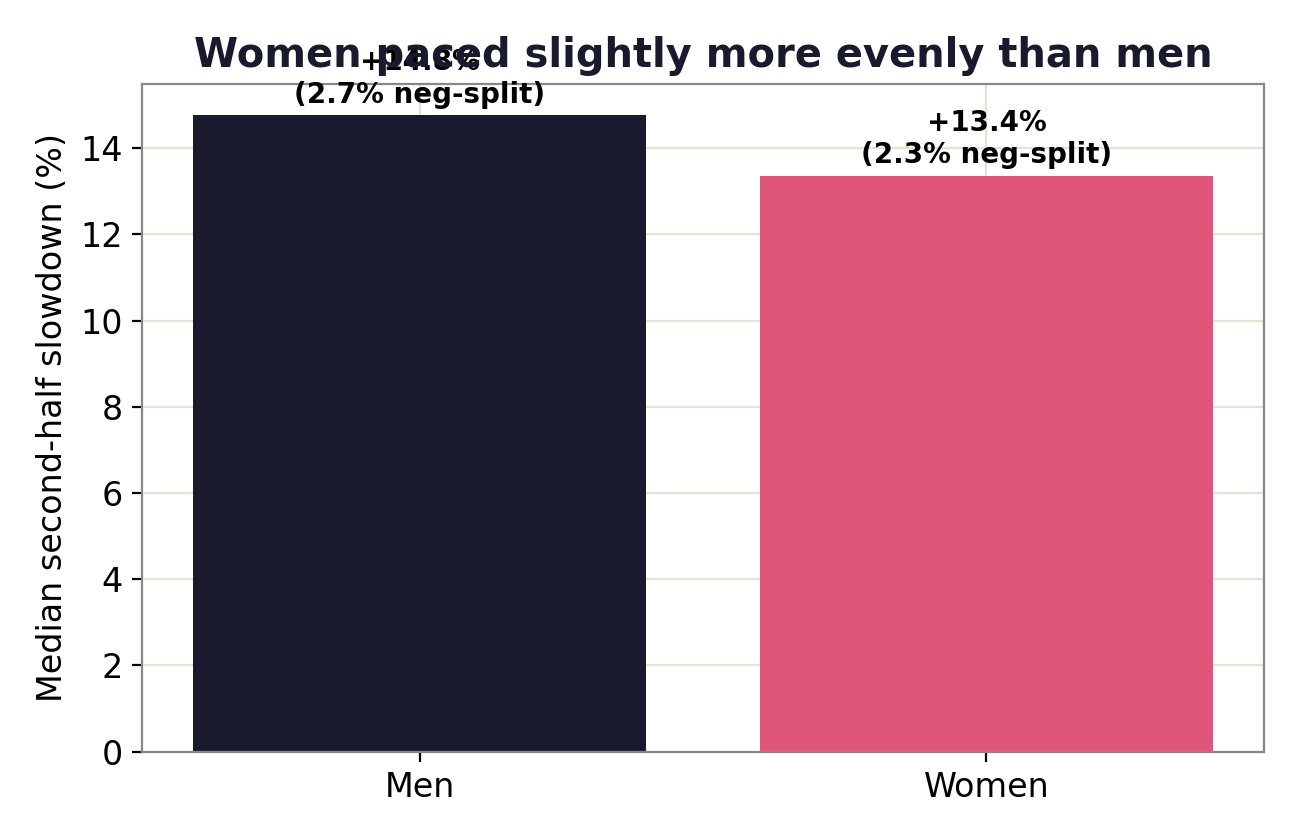
A median slowdown of about 13.4% against 14.8% for men. It is a real gap and it points the same way as other published work on the question, but it is small next to the ability effect above. Worth reporting; not worth a headline.
↓ what this cannot tell you
One race, one day, one course
This is a single edition of a single marathon, and Boston is not a neutral course. It drops sharply for the first few miles and puts its hills between 16 and 21 miles, which is close to the worst possible arrangement for holding an even split. Some of the 14% is the course rather than the runner.
Boston is also a qualifying race, so this field is faster and more experienced than a typical big-city marathon. If anything that biases toward even pacing. A general-entry field would likely fade harder, not less.
What survives those caveats is the shape rather than the exact number. The lopsidedness is enormous, it points the same way in every field that has been looked at, and no plausible course correction moves 2.5% anywhere near half.
↓ so what
The useful reading is the reverse one
It would be easy to take this as "negative splitting is a myth, stop trying." That is the wrong lesson. The runners who came closest to even pacing are the ones who ran fastest, and the error the field makes is overwhelmingly in one direction.
Out of 31,912 people, essentially nobody made the mistake of starting too slowly. Whatever pace feels right at the start line, the entire field suggests it is too fast.
The finding, stated usefullyFinish · how it was built
Where the numbers come from
Two Python files, no manual steps. fetch_data.py pulls the
results, analyze.py writes every figure and table on this page.
The raw data is git-ignored and re-downloaded on demand; the outputs are
committed, so the repository shows its work.
- Data
- Official 2014 Boston Marathon results, via the public llimllib/bostonmarathon mirror
- Sample
- 31,912 finishers carrying a valid half-marathon split
- Definition
- First half = the half-marathon mat time. Second half = finish − half. Negative split = second < first
- Built with
- Python, pandas, matplotlib
- Reproduce
pip install -r requirements.txt, thenpython fetch_data.py && python analyze.py- Companion study
- Hitting the Wall, which follows the same field 5 km at a time to find where the fade starts